EX-99.1
Published on July 29, 2025


Q2 2025 Shareholder Letter
IR.MARA.COM

Key Highlights
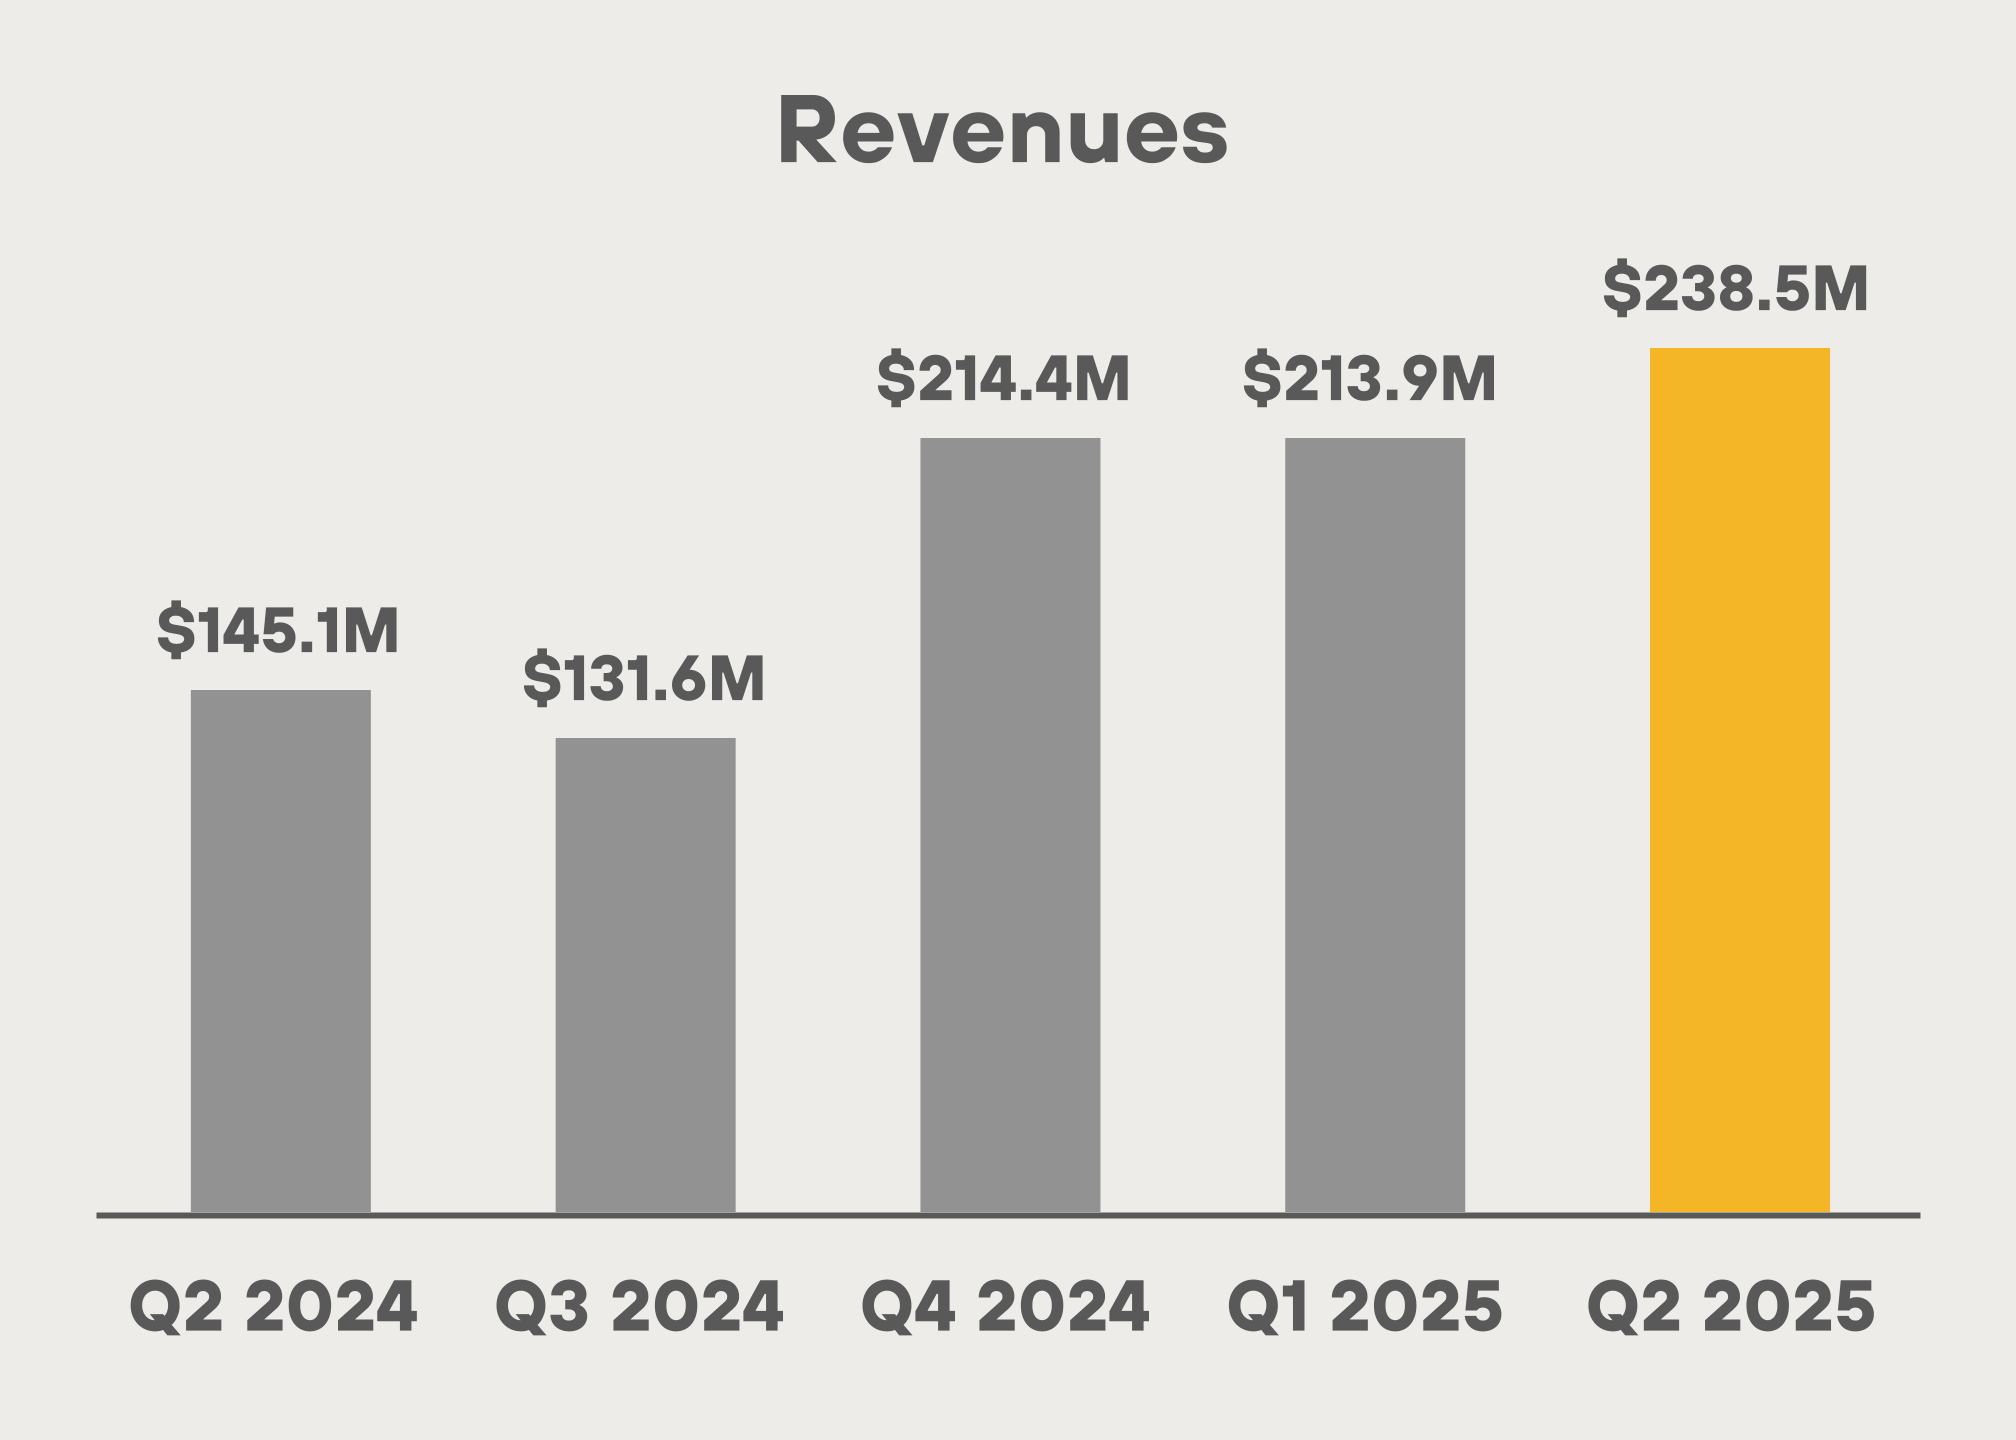
Revenues increased
64% to $238.5 million
|
IN Q2 2025
|
from $145.1 million in Q2 2024.
|
Net income (loss)
increased 505%
|
TO $808.2 MILLION
|
in Q2 2025 from ($199.7) million in Q2 2024.
|
Adjusted EBITDA
increased 1093%
|
$1.2 BILLION |
compared to ($125.5) million in Q2 2024.
|
Cost/petahash per
day improved by 24%
|
IN Q2 2025
|
from Q2 2024.
|
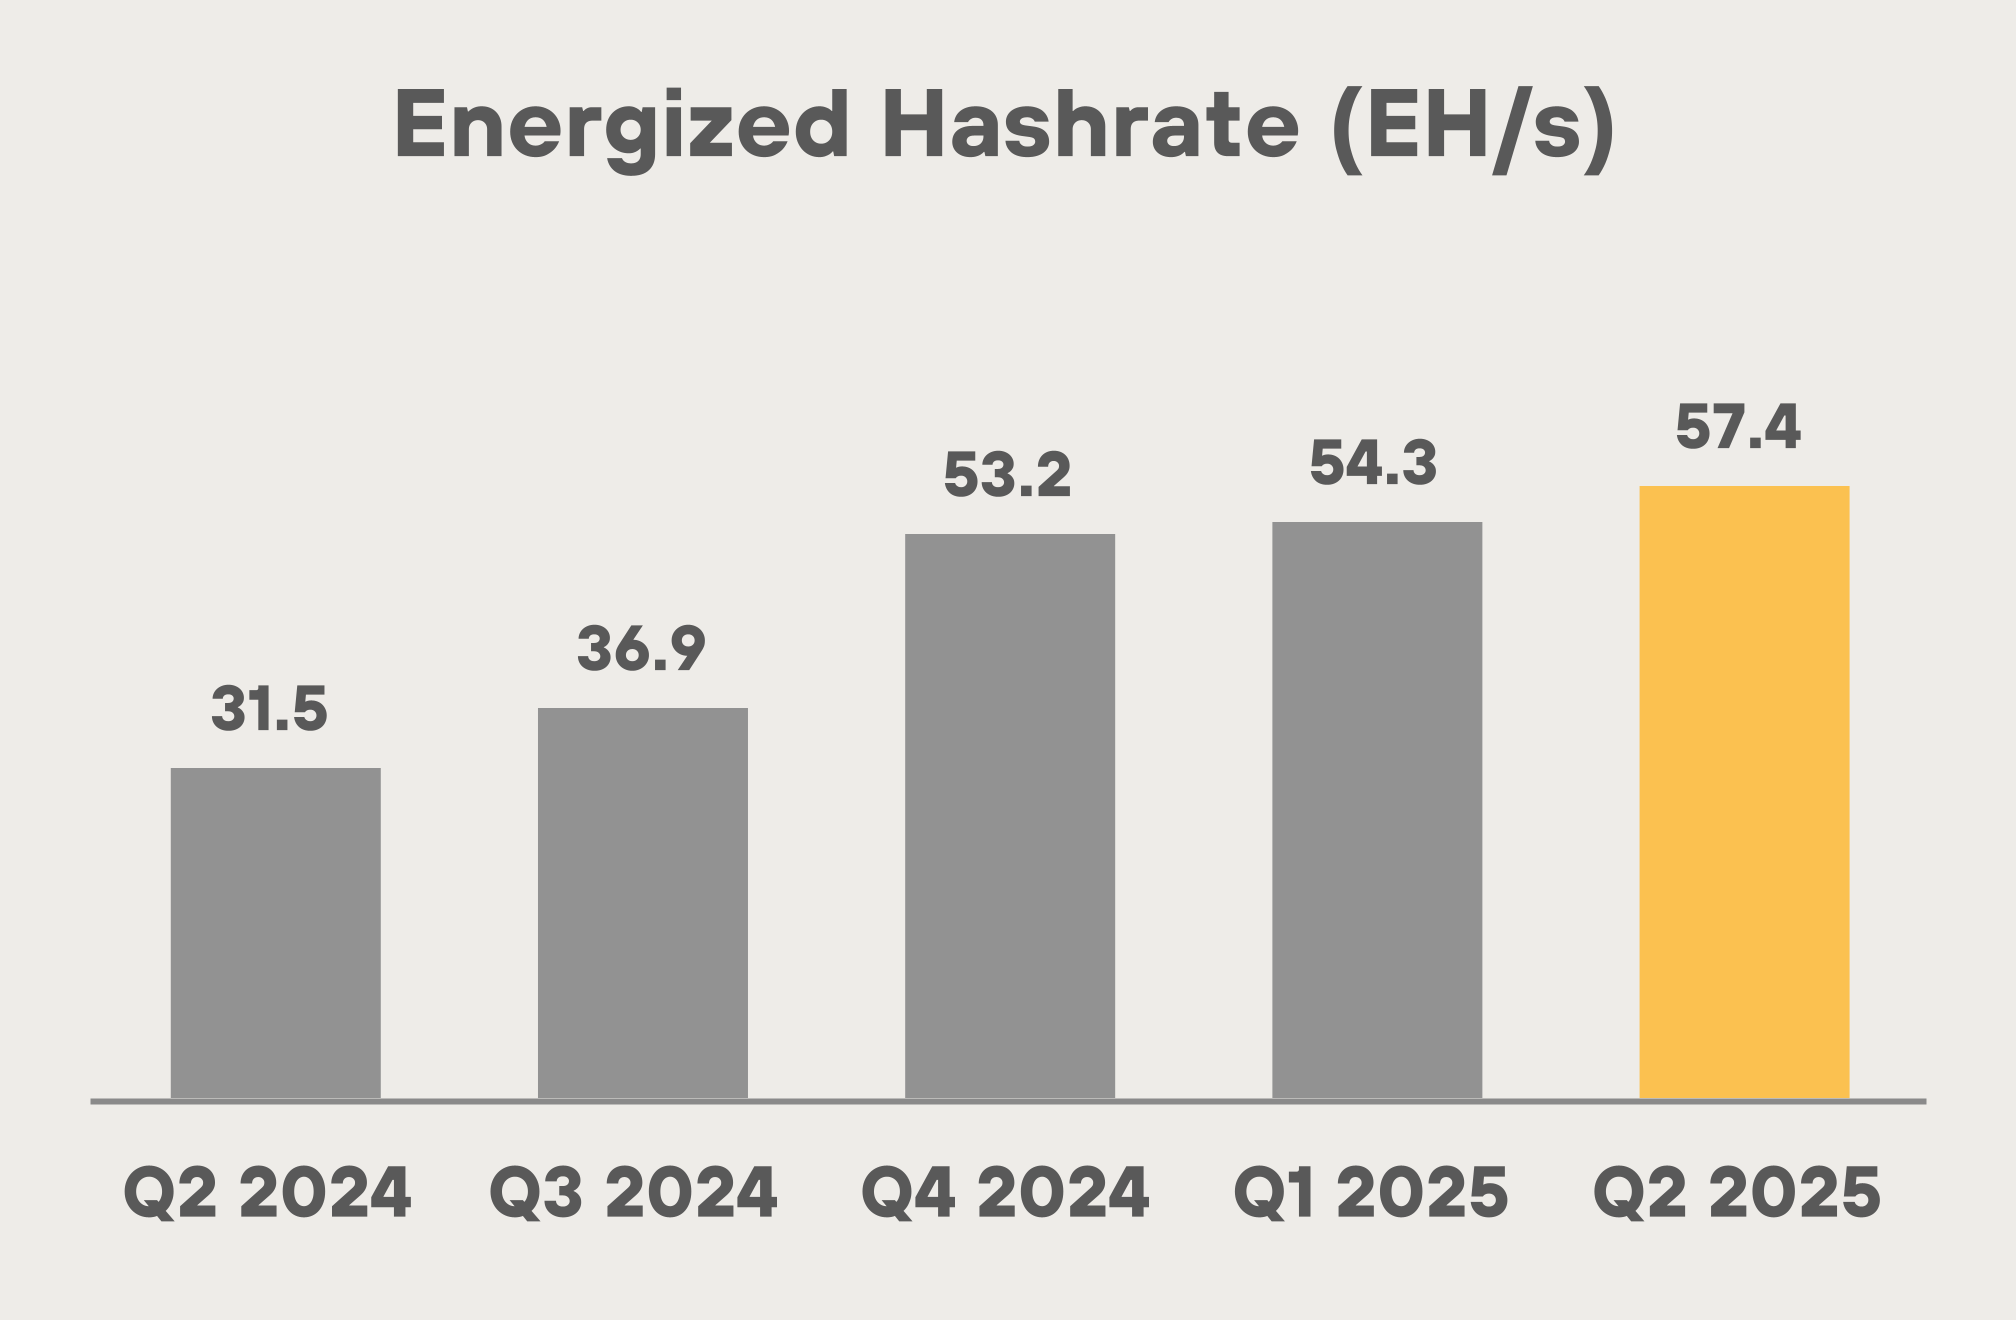
Energized hashrate
("EH/s") increased 82%
|
TO 57.4 EH/S IN Q2 2025
|
from 31.5 EH/s in Q2 2024.
|
Bitcoin holdings
increased 170%
|
TO 49,951 BTC (C. $5.3B)
|
Including 15,550 BTC loaned, actively managed and pledged as
collateral as of June 30, 2025.
|
Total blocks won
increased 52% to 694
|
IN Q2 2025
|
from 457 in Q2 2024.
|
Purchased energy cost per
BTC $33,735
|
IN Q2 2025
|
for our owned sites |
Cost per kWh: $0.04
|
FOR Q2 2025
|
Mined 2,358 BTC
|
IN Q2 2025
|
There were no purchases in Q2 2025 |
SHAREHOLDER LETTER Q2 2025 3
To Our Shareholder
The media often paints a picture that there is not enough energy to meet the needs of data centers. The truth is that there
is ample energy; data centers just need more flexible load profiles. According to a recent Duke study, between 76 and 126
gigawatts of capacity are available for data centers provided they can curtail just 0.5% to 1.0% of the time. However, most
forms of compute, from traditional workloads to AI inference, are inflexible by nature requiring constant uptime. The
energy is there; data centers simply can’t adjust to when it is available. At least not without help.
This is where MARA can unlock energy for data centers.
As global demand for compute and energy accelerates, our role at the intersection of these forces has never been more
apparent: we are evolving into a digital energy company. We are on a mission to advance the world’s energy systems by
providing flexible demand for underutilized power.
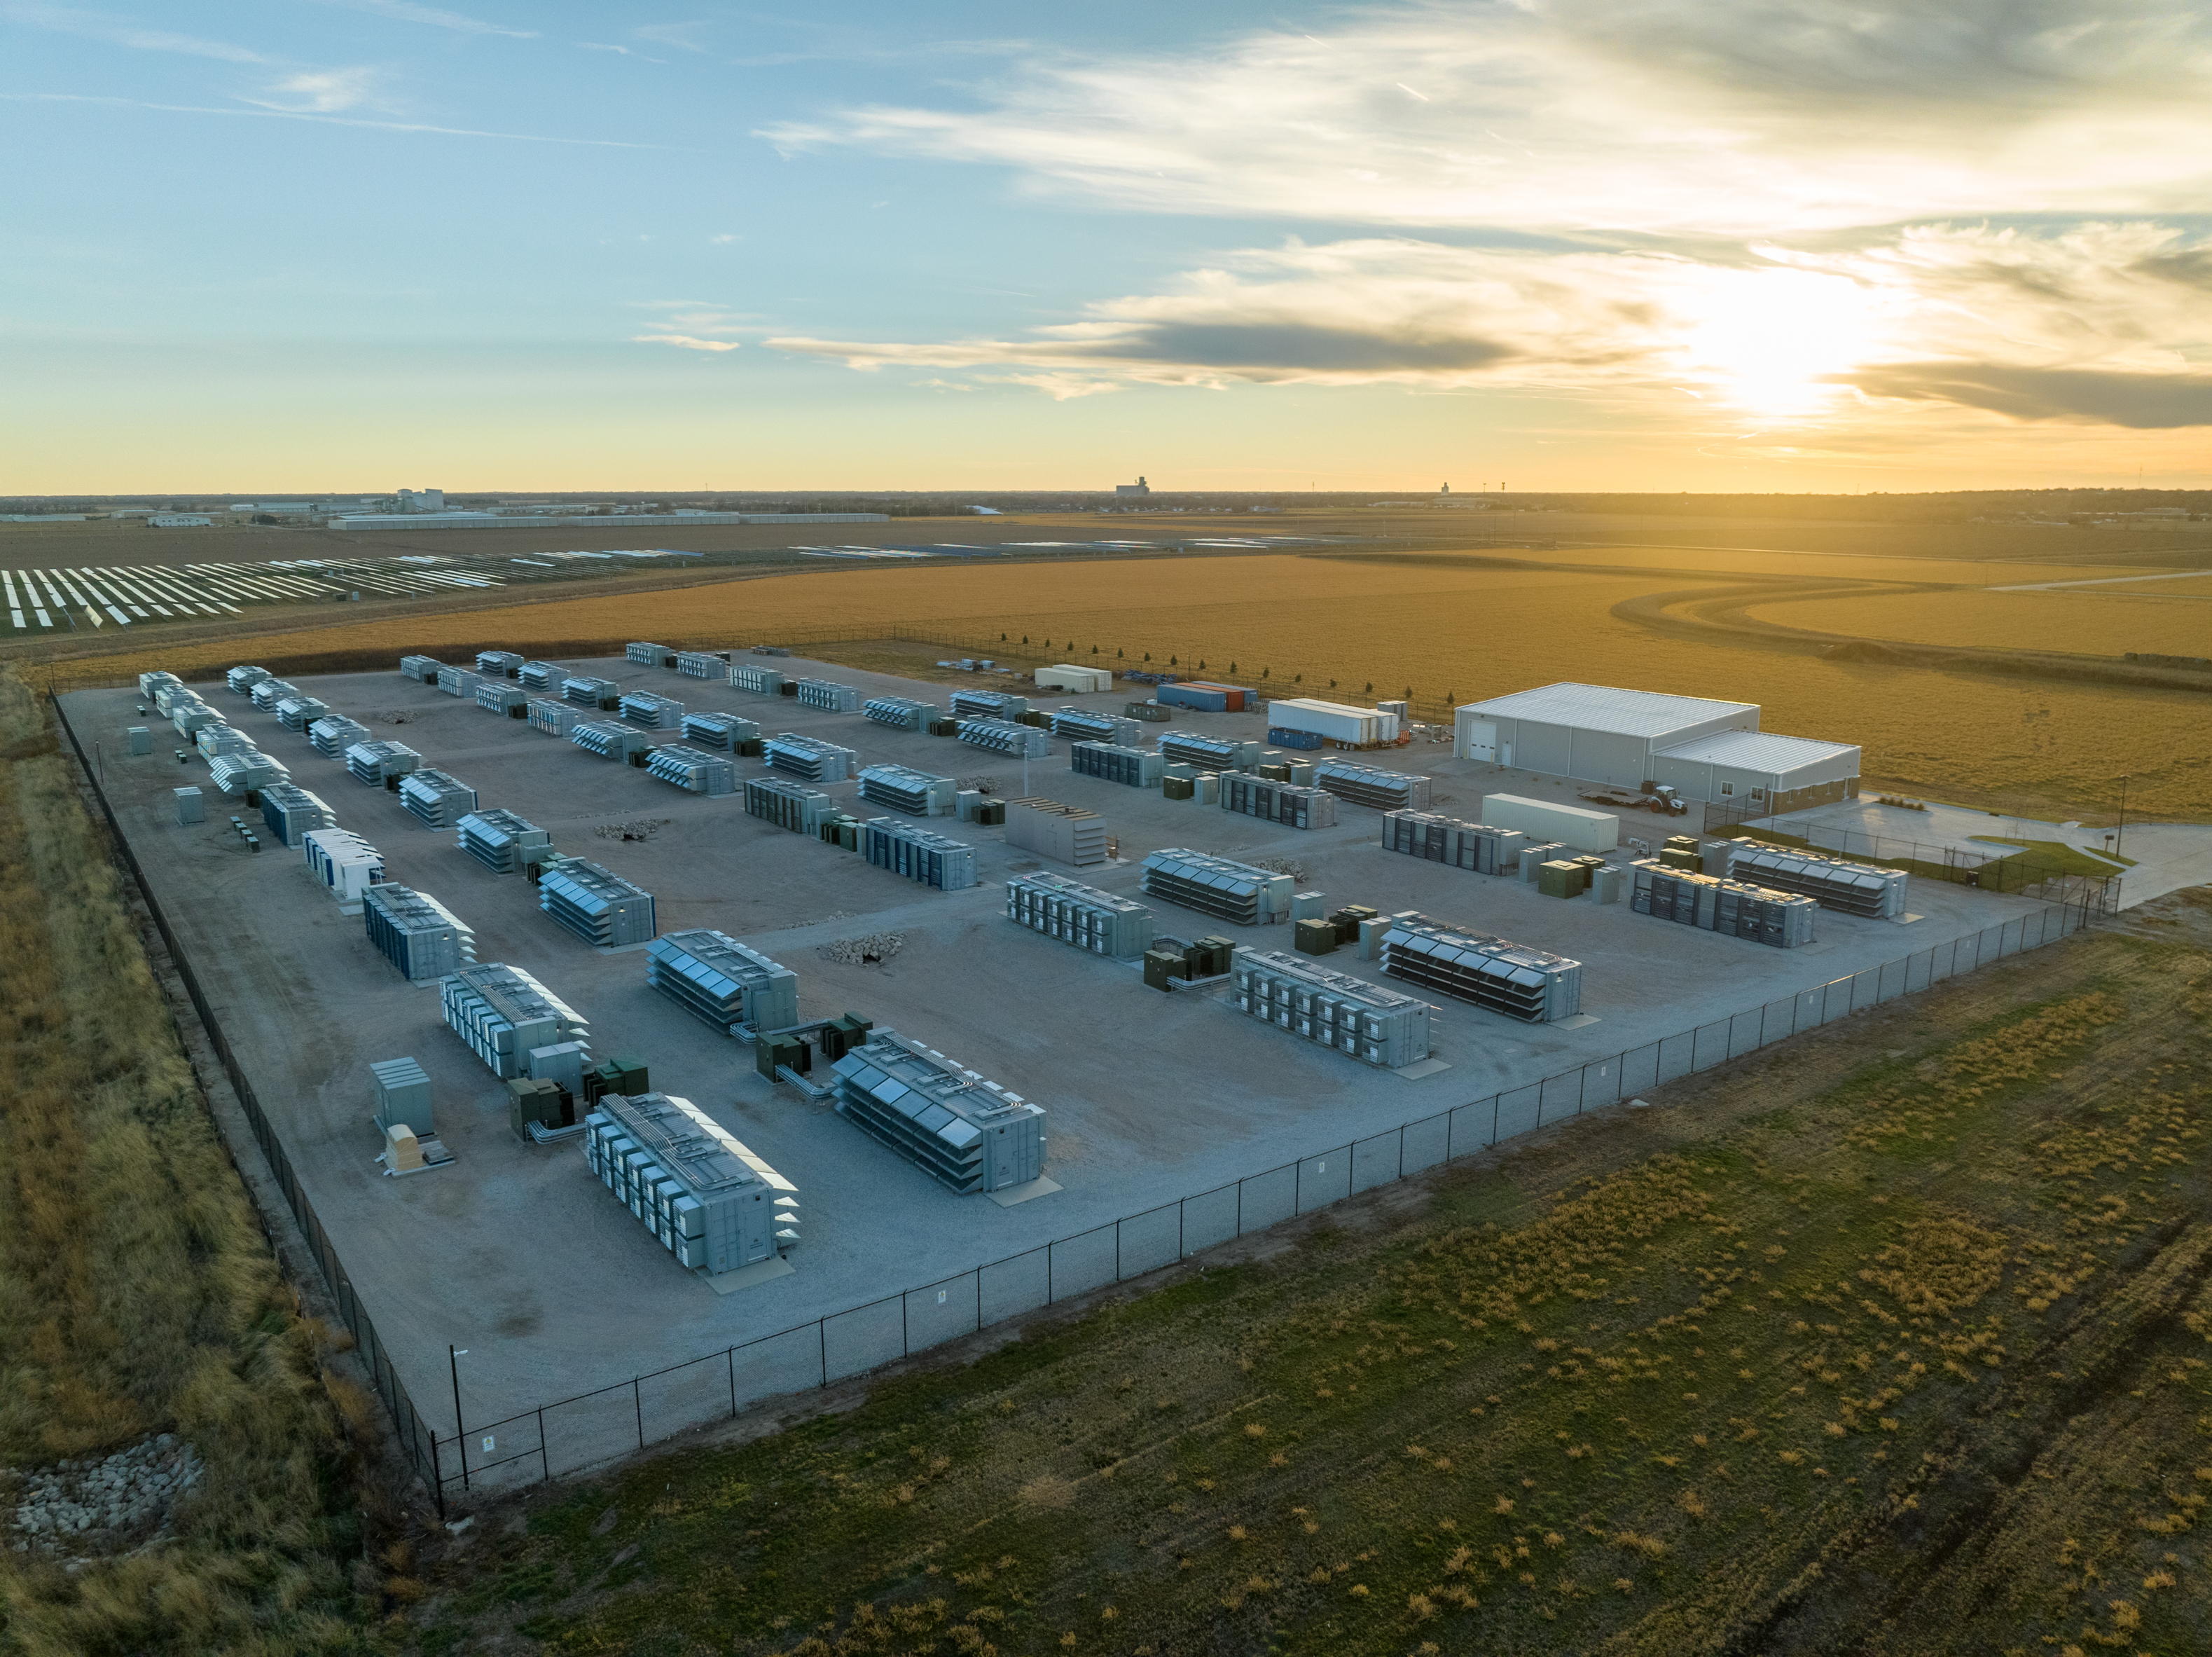
We operate a large portfolio of flexible data centers internationally. While many data center operators manage just tens of
megawatts, our facilities are engineered for 100+ megawatt workloads. And they can curtail within minutes. This expertise
is only becoming more valuable as global demand for capacity continues to rise.
Currently, our workloads are anchored in bitcoin mining, which we believe is the most scalable and adaptable digital
energy technology in the world today, transforming how energy is produced, delivered, and consumed. But the
opportunity extends far beyond mining on its own. We are now exploring ways for our infrastructure to support hybrid
applications, including AI inference and HPC. This unlocks entirely new ways to orchestrate power and maximize the value
of every electron.
While we continued to advance this vision in Q2, we also delivered record results:
•Record-setting quarter in terms of revenues, Adjusted EBITDA, net income, energized hashrate, fleet
efficiency and blocks produced in a single month.
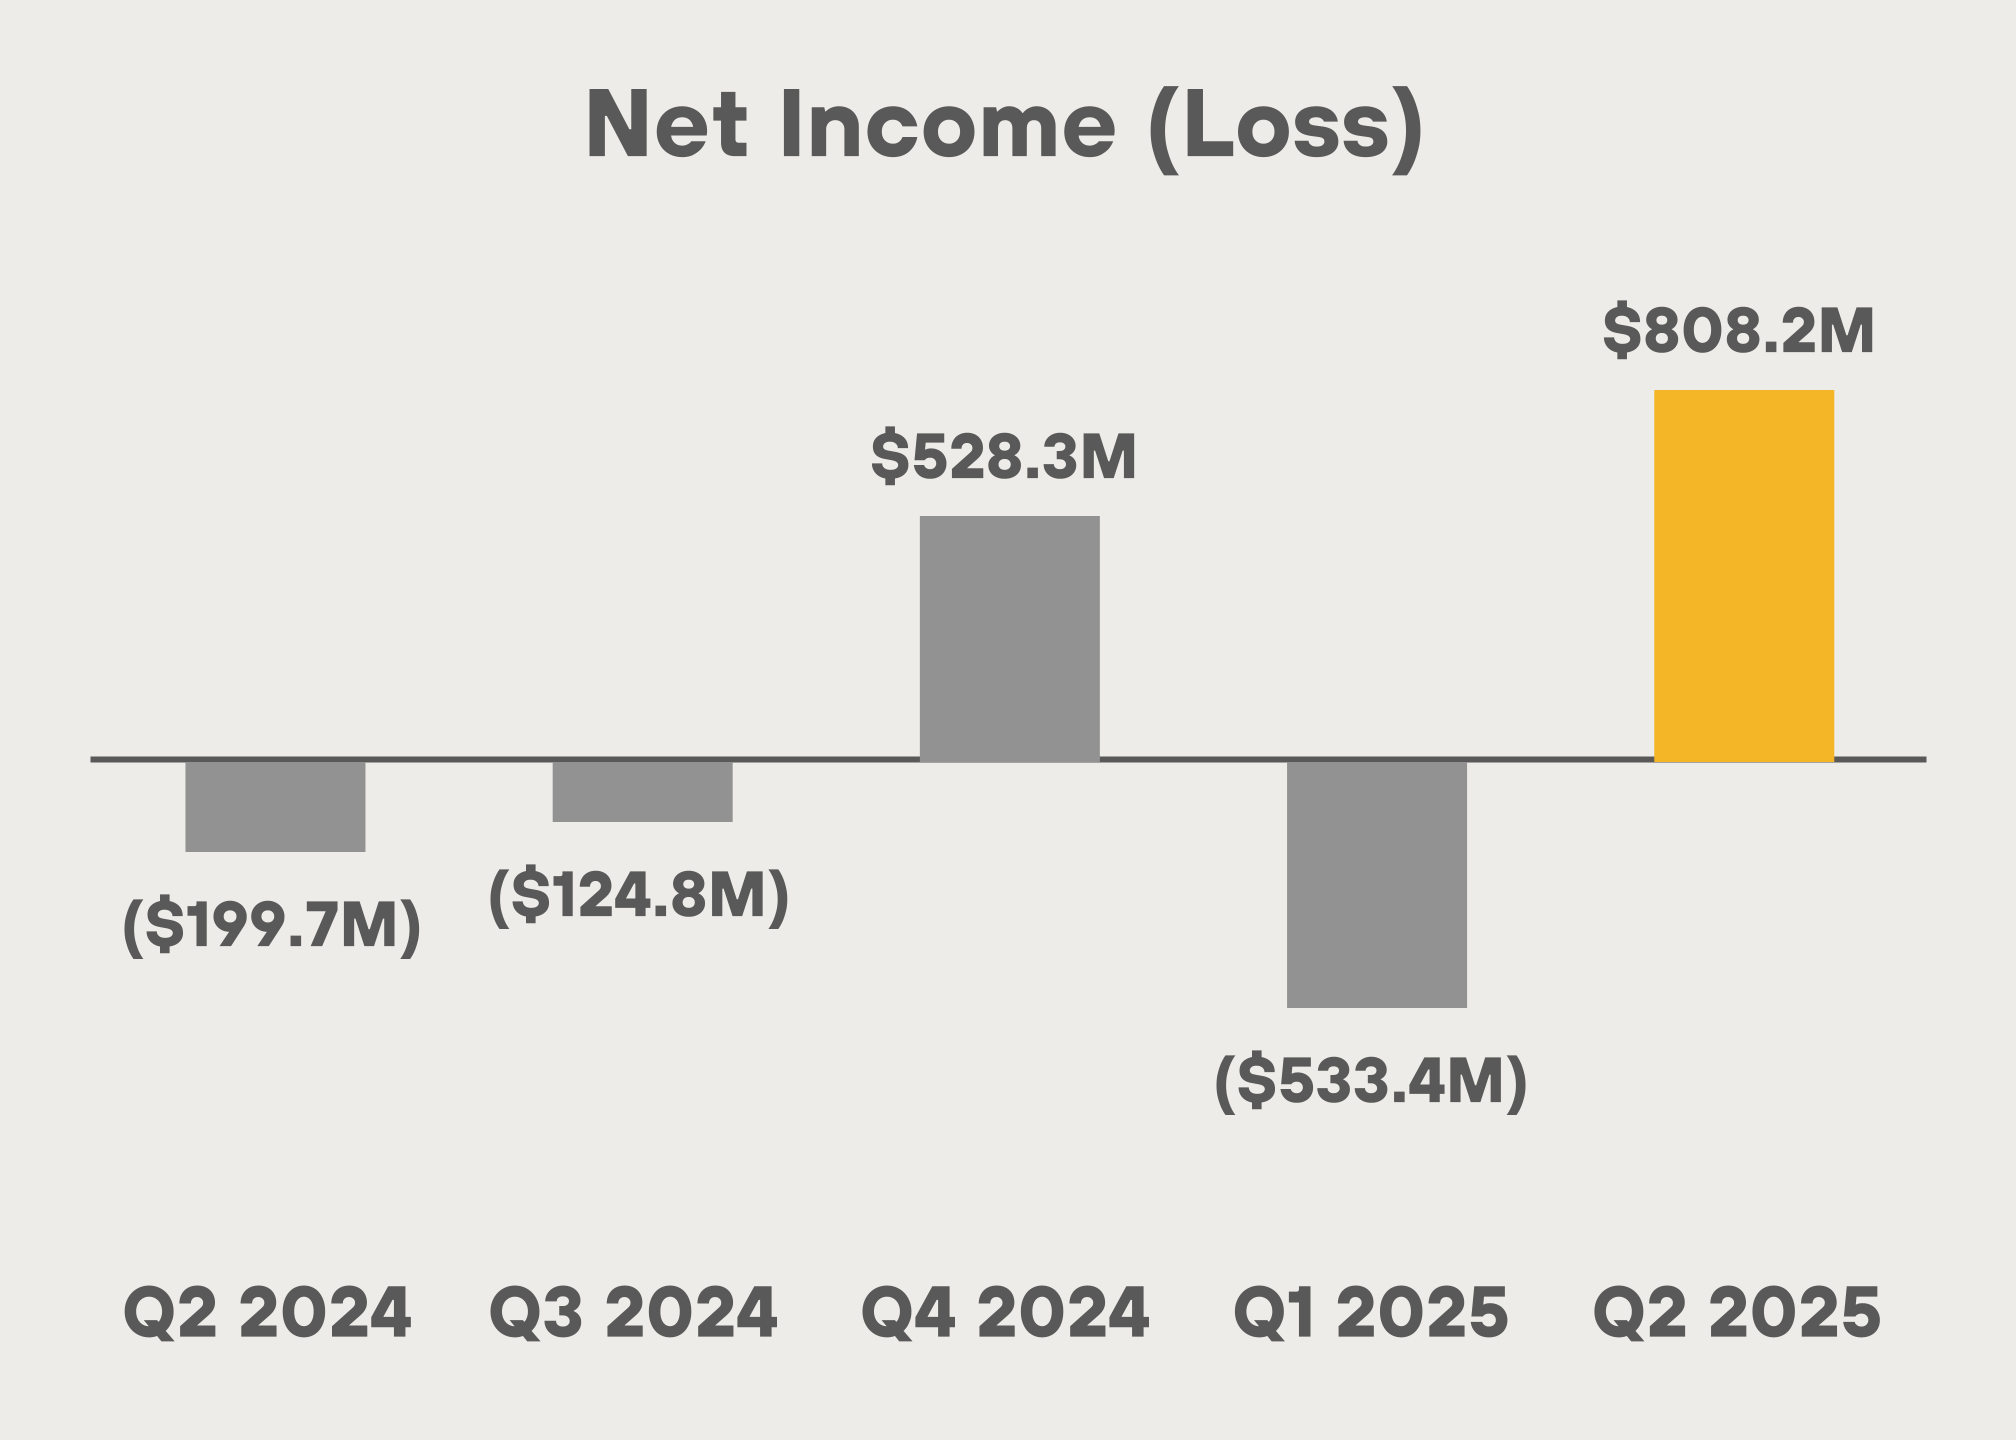
•Achieved an unrealized gain on digital assets of $1.2 billion and net profit of approximately $808 million,
driven by strong operational execution and bitcoin’s appreciation to $107,173 by quarter-end.
•Shortly after quarter-end, MARA's bitcoin holdings surpassed 50,000 BTC, solidifying our position as
the second-largest corporate public holder of bitcoin — a treasury earned through infrastructure,
execution, and scale.
•Announced strategic partnerships with Google-backed TAE Power Solutions and LG-backed PADO AI to
co-develop grid-responsive, load-balancing platforms for next-generation AI infrastructure.
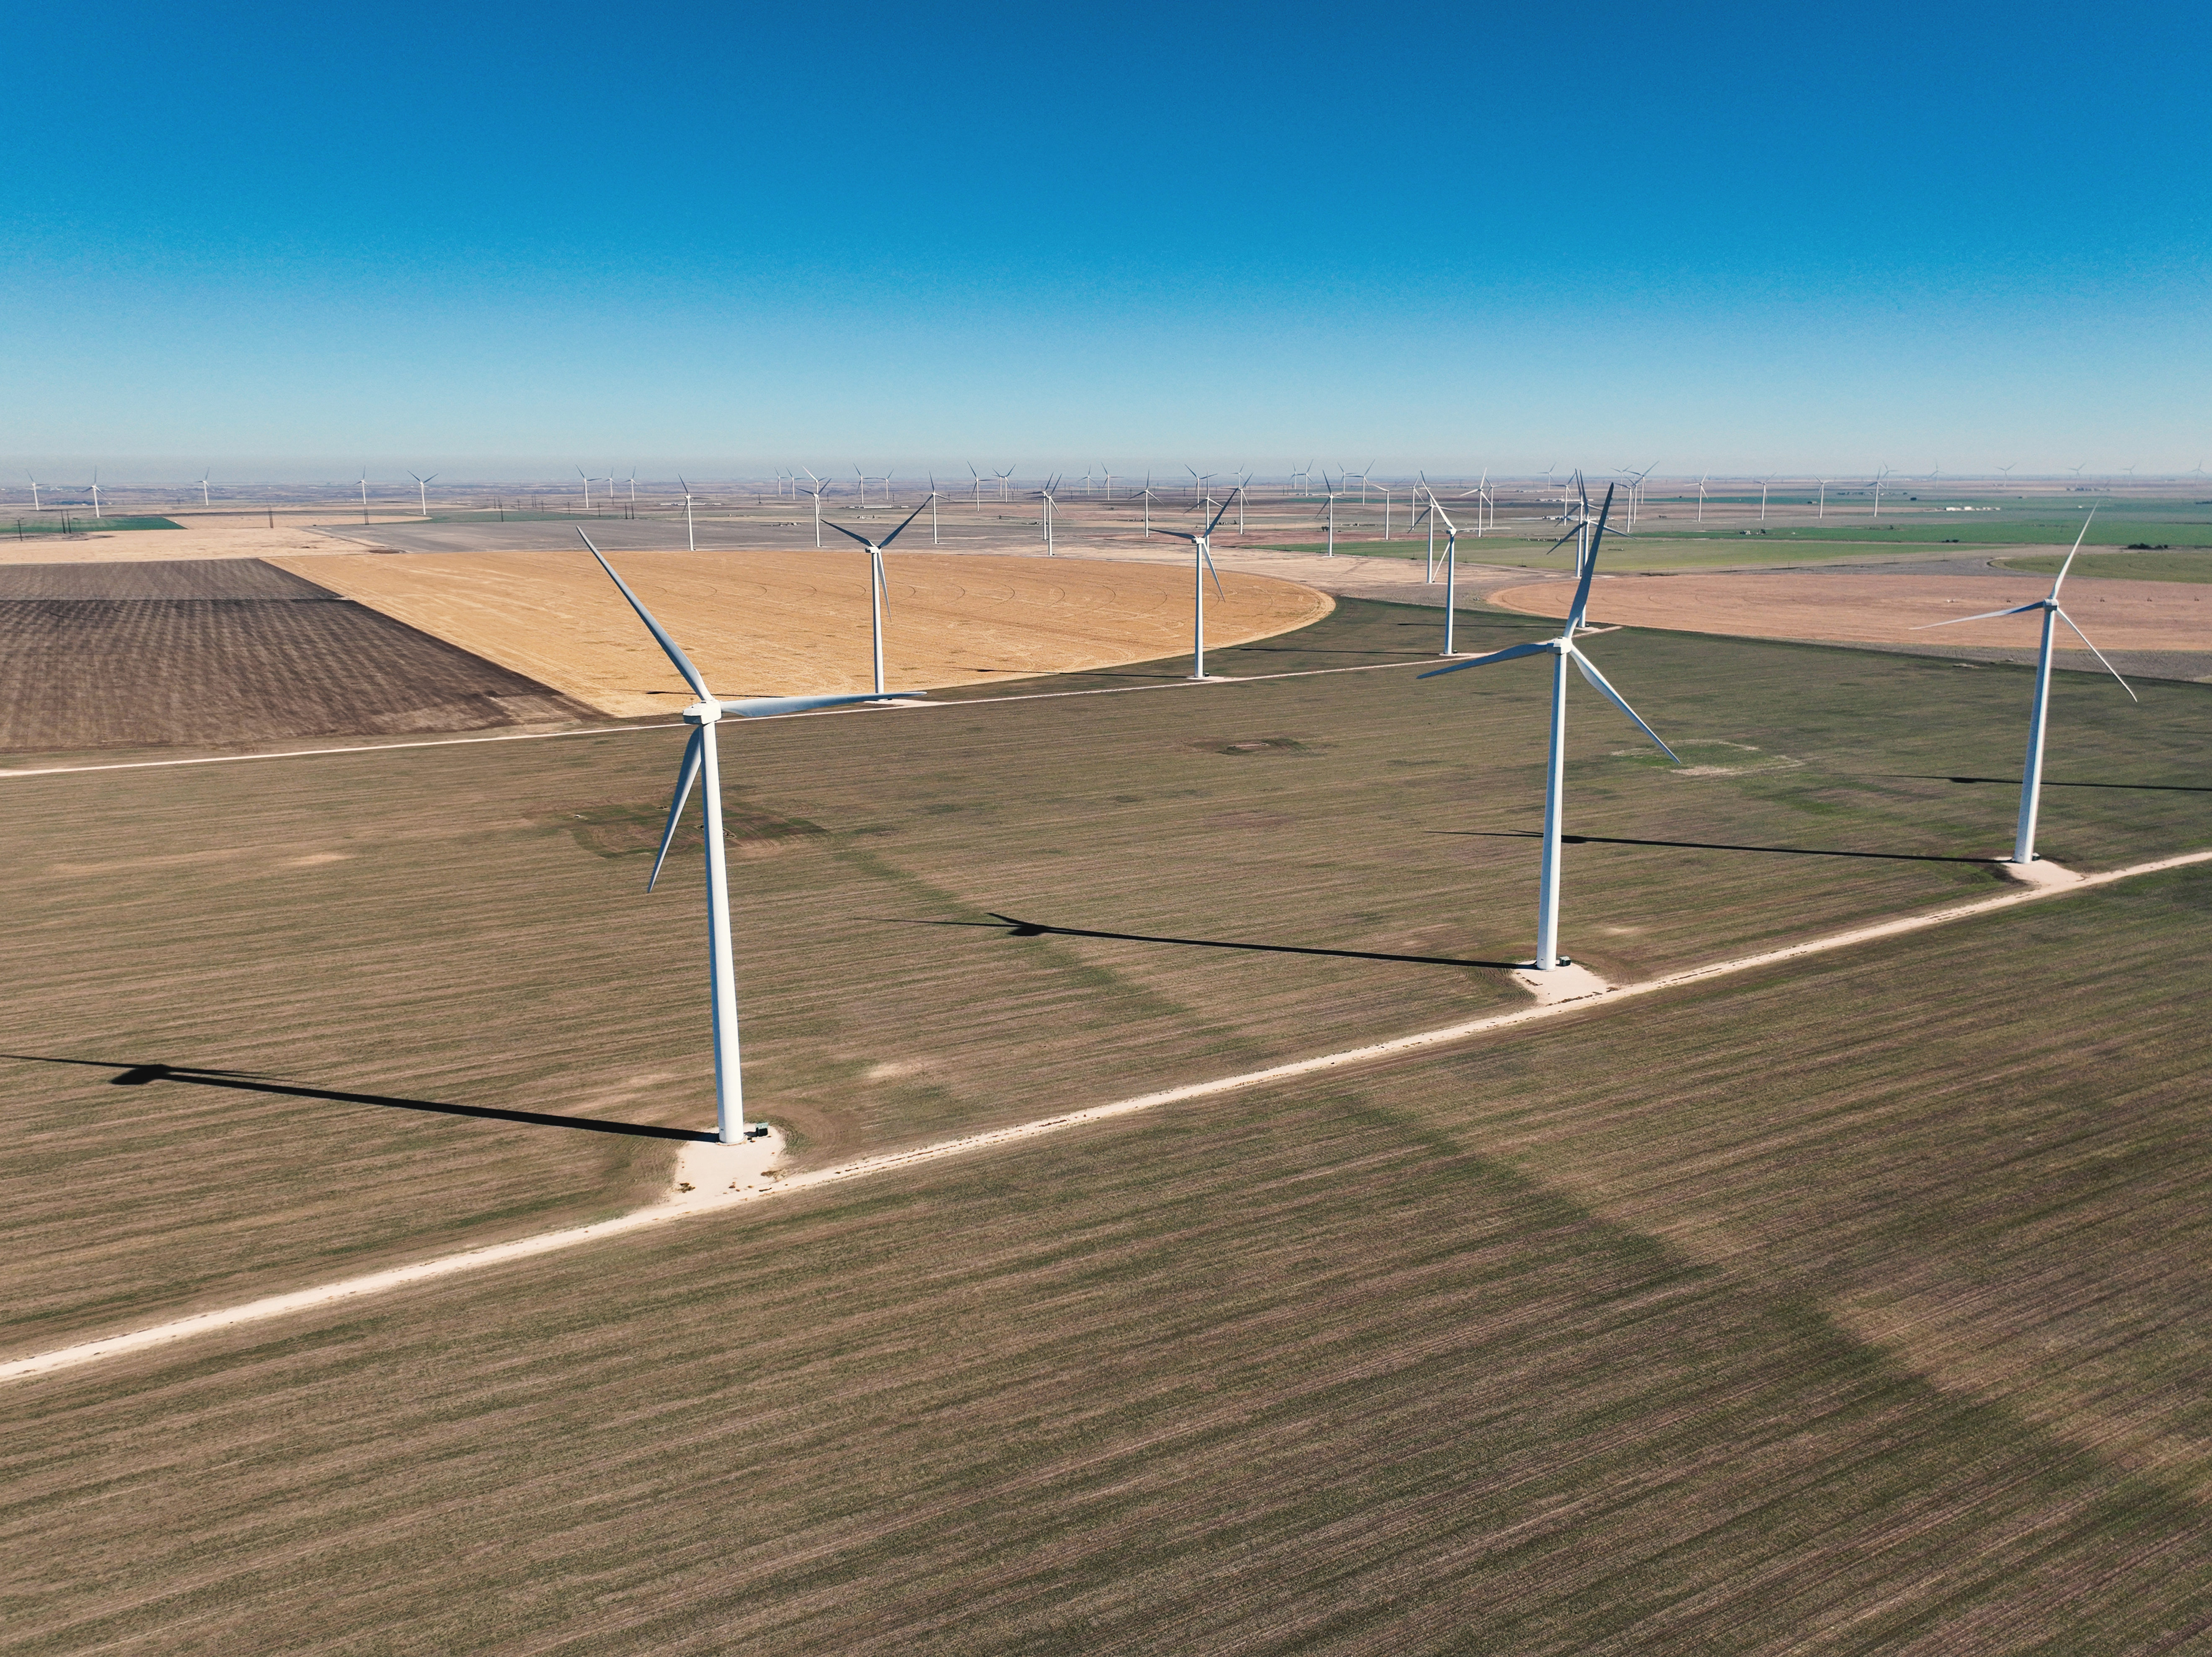
•Completed construction of a new behind-the-meter data center at our Hansford County, Texas wind
farm, enabling low-cost power generation and improving operational efficiency.
With momentum building across our mining and infrastructure portfolios, we remain on track to reach our year-end target
of 75 exahash (EH/s). But this is only the beginning.
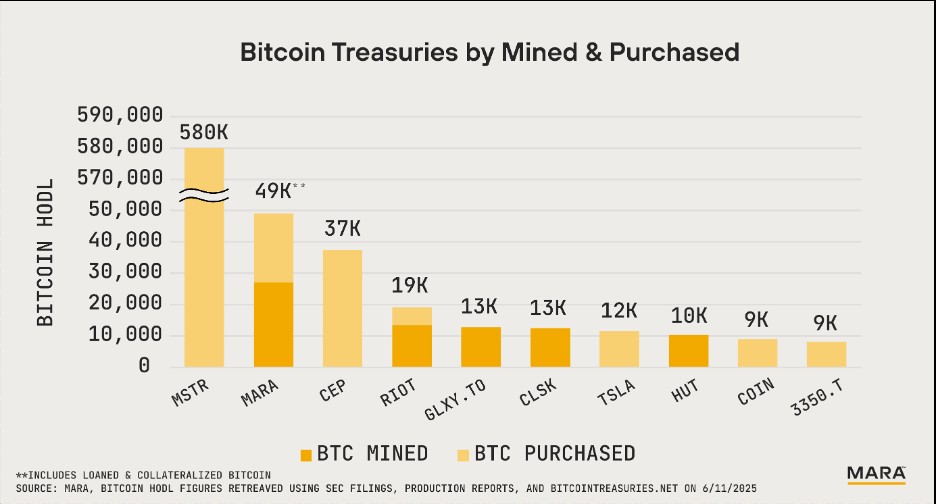
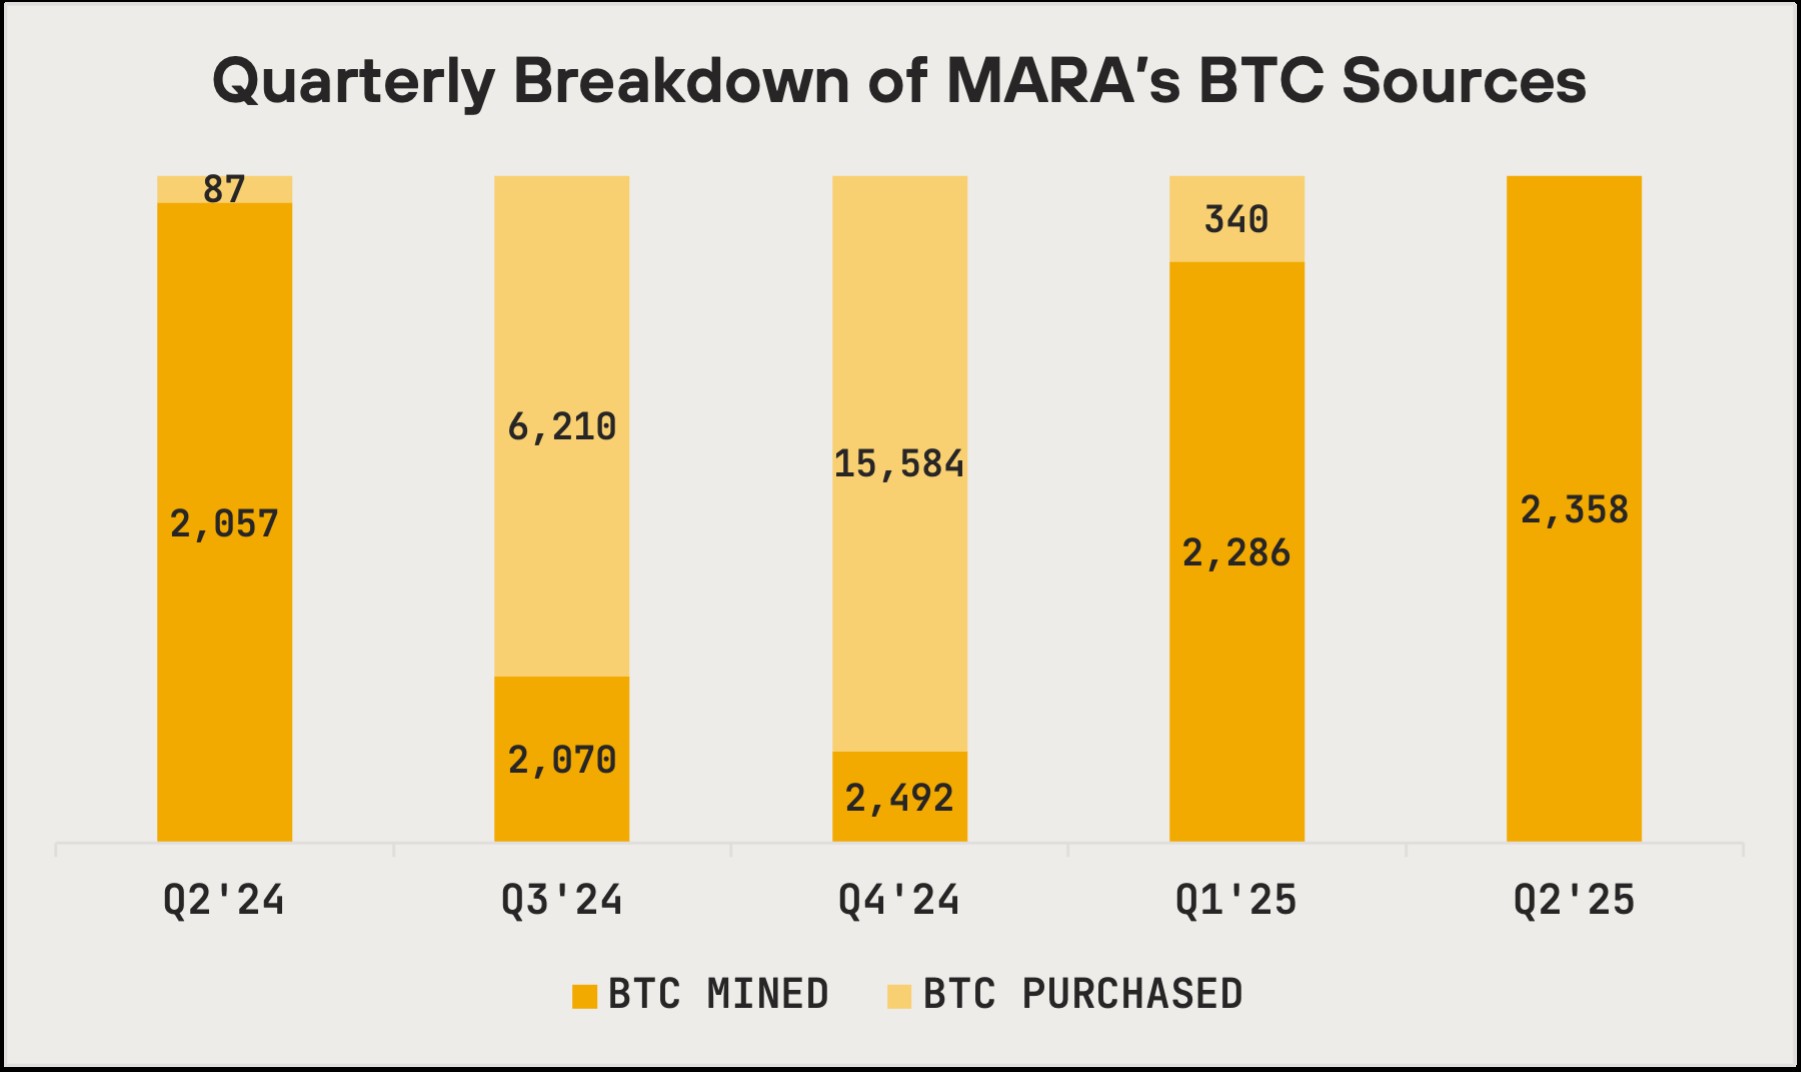
We are one of the largest holders of bitcoin because mining bitcoin is our business
Our bitcoin holdings increased to 49,951 bitcoin at the end of June, with 2,358 bitcoin mined over the quarter.
Our treasury has positioned us as one of the largest corporate holders of bitcoin globally, and we are proud of that
position. But unlike bitcoin treasury companies what sets MARA apart is how we got here: the majority of our bitcoin was
mined, not purchased.
SHAREHOLDER LETTER Q2 2025 4
It was earned through operational excellence and years of building industrial-scale mining capacity. This difference
matters.
While recent quarters have seen a rise in companies positioning themselves as bitcoin treasury vehicles, the value of that
model is increasingly being called into question. In a recent article, Professor Aswath Damodaran of NYU’s Stern School of
Business argues that when companies with clear operating models divert corporate cash into bitcoin, it can blur their
strategic focus and confuse their core business narrative.
There are exceptions, of course. But for most companies, it’s no longer a capital strategy, but a branding exercise that
distracts from stagnating business models.
We are a bitcoin miner at our core, focused on building a resilient and sustainable business. We accomplish this by using
mining not just to acquire bitcoin but also to optimize energy systems, monetize stranded assets, and advance our position
in digital energy infrastructure.
We’ve built MARA at the intersection of two of the fastest-growing industries on Earth: energy and compute. In
doing so, we’re working to define a new category of company, one that powers the technologies shaping the future.
That’s why we believe MARA is fundamentally different. We are more than a bitcoin treasury company.
And because we are operators, not just holders, we view bitcoin as a productive asset. We actively deploy portions of our
holdings to enhance returns and strengthen our long-term capital position.
SHAREHOLDER LETTER Q2 2025 5
Measures to Accelerate Operational Efficiency
MARA’s purchased energy costs per bitcoin for the second quarter was $33,735, and cost per petahash per day decreased
by 24% year-over-year, both remaining among the lowest in the sector.
We continue to improve our direct energy costs through operational discipline and site ownership. As we have noted in
prior reports, we’ve made meaningful progress over the past year in reducing our reliance on third parties, growing our
owned and operated data center portfolio from 0% to 70%. This transition has not only allowed us to better align energy
procurement with our needs, but also to continue implementing infrastructure-level enhancements that materially impact
efficiency.
Throughout the quarters, we’ve introduced a range of site improvements, including advanced cooling systems, designed
to boost energy efficiency and increase uptime. Over the past 10 quarters, these efforts have resulted in meaningful
and sustained reductions in our cost per petahash per day of 47%.
MARA’s commitment to long-term cost efficiency is further supported by strategic investments in owned power
infrastructure, including our 114 MW wind farm in Texas, which now has an onsite data center that we expect to begin
energization in the second-half of the year. Additionally, by pairing low-cost renewable energy with previous generation
ASICs through our asset deprecation model, we expect to extend their useful life while revitalizing the wind farm, thereby
reducing both CAPEX spend on new machines and e-waste.
Global Energy Partnerships to Monetize Stranded Energy
As part of our long-term strategy, we continue to pursue partnerships with leading energy companies to leverage bitcoin
mining as a large, flexible load that can help optimize power assets globally. These collaborations are increasingly focused
at the enterprise level, allowing us to integrate with grid operators and utilities to enhance grid stability while monetizing
otherwise underutilized or stranded electrons.
International Expansion Remains a Top Priority
Given ongoing discussions with overseas partners, we remain committed to generating more than 50% of our revenues
from international markets by 2028. We believe large pockets of underutilized energy around the world, particularly in
regions with excess renewable or stranded capacity, present a unique opportunity to scale our operations in a capital-
efficient manner. Our strategy centers on forming structured joint ventures with sovereign power entities and leveraging
global partnerships to access low-cost energy, reduce capital intensity, and share development risk. By potentially
expanding our asset deprecation model abroad, we aim to strengthen our sustainability profile and reinforce our position
as a low-cost leader in digital infrastructure.
Advancing Inference and AI Infrastructure on the Edge
Bitcoin mining started just over a decade ago powered by hobbyists on laptops and GPUs. Since then, it has evolved into
one of the most powerful computing sectors in the world. Scaling at this rate required a new level of sophistication in
power strategy, infrastructure design, and operational discipline.
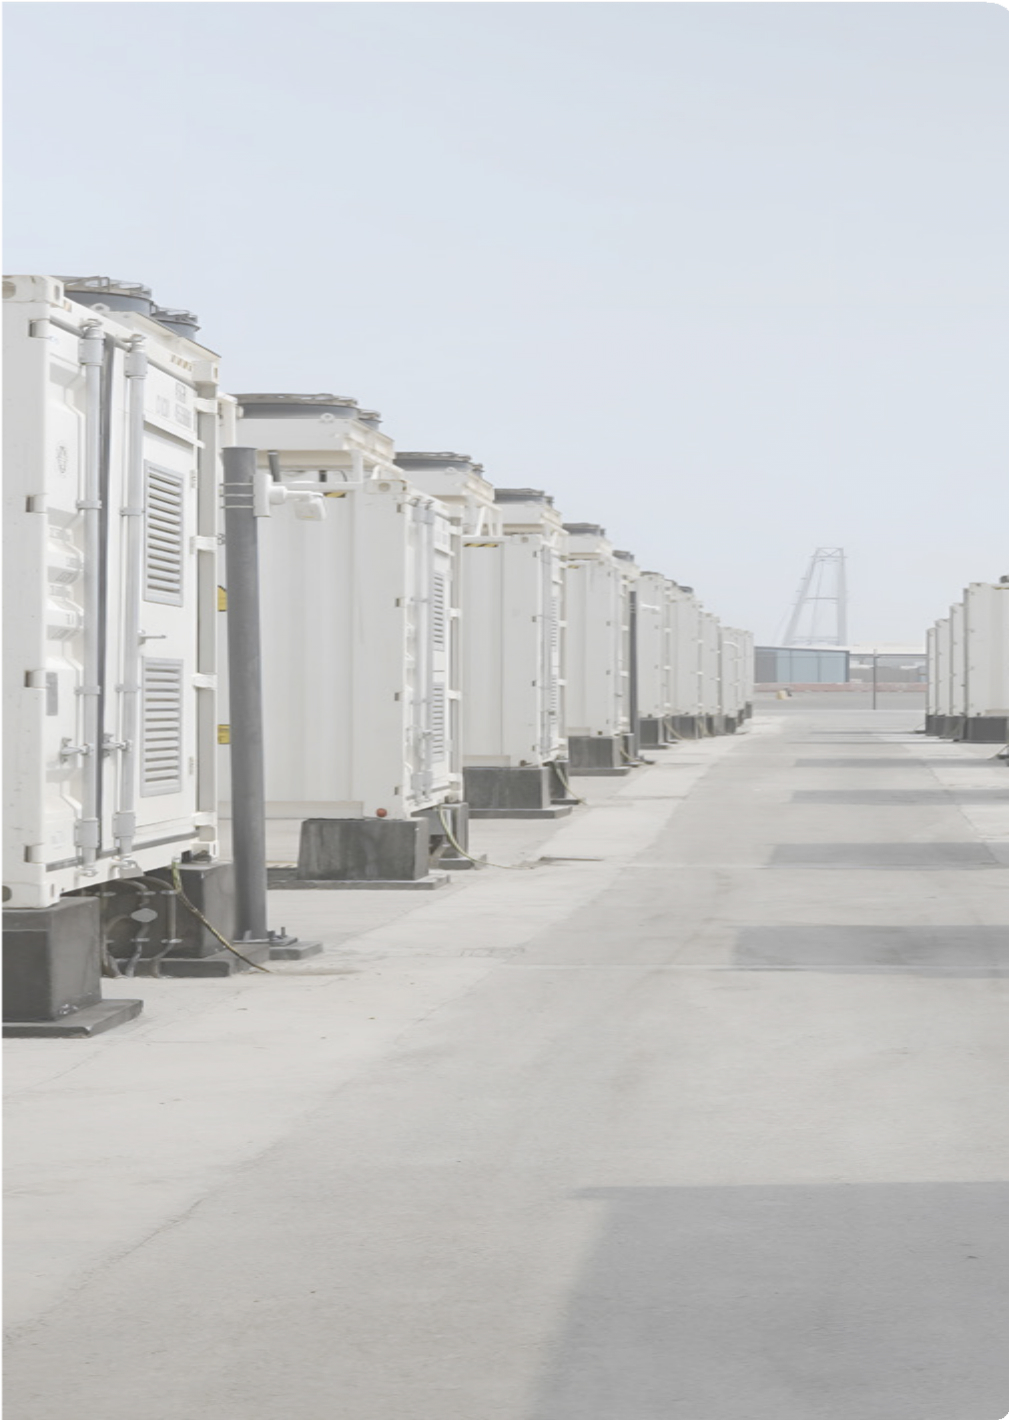
MARA became the largest public operator in this category by 1) securing low-cost power at scale and 2) deploying 57.4
exahash of compute across 15 sites and four continents. This level of operational depth is rare. Our lessons learned are
now more applicable, and more valuable, than ever to AI infrastructure.
As AI demands more power, more uptime, and more scale, MARA is positioned to lead.
This quarter, we began laying the foundation for a new era of AI infrastructure: deploying custom miners and pursuing
partnerships that reflect our vision for sovereign, energy-aware compute.
SHAREHOLDER LETTER Q2 2025 6
“Generative AI processing will shift rapidly from training to inferencing activities in the next three years... Product leaders
must innovate early and optimize hardware for diverse GenAI model sizes, types and use cases to meet end-user needs or
risk losing market share.”
– Gartner, Emerging Tech: AI Hardware Will Evolve to Meet Inference Requirements, 2025
Inference is rapidly emerging as the dominant workload in AI infrastructure, with research from Gartner projecting a 42%
CAGR for inference servers through 2028, compared to 24% for training servers. Yet this trend brings challenges:
inference workloads are highly volatile and are also inherently inflexible, placing strain on the grid and making it difficult for
them to access the 76+ gigawatts of available capacity on the U.S. grid for flexible consumers, as highlighted in Duke’s
study, Rethinking Load Growth. Without purpose-built infrastructure, these constraints could severely stall the growth of
AI inference.
At MARA, we’ve anticipated these shifts and are building solutions designed for the future of AI workloads. We announced
partnerships with TAE Power Solutions and LG-backed PADO AI, companies that specialize in high-efficiency energy
systems and advanced AI infrastructure, respectively. These collaborations focus on developing grid-responsive platforms
that dynamically stabilize inference compute, minimize energy waste, and unlock the next generation of field-
deployable, sovereign edge AI infrastructure.
“Many edge computing use cases are latency-sensitive and data-intensive, and require a level of autonomy and data
sovereignty, for local decision intelligence.”
-Gartner, Hype Cycle for Artificial Intelligence, 2025
The global race for AI compute has produced a new class of cloud monopolies that are rich in capital and silicon but offer
little sovereignty. As critical systems increasingly depend on large language models and inference engines, nations and
institutions are waking up to a stark reality: much of today’s AI infrastructure is offshore, opaque, and governed by
platforms they don’t control.
MARA comes from a different tradition.
Our roots are in bitcoin mining, in building verifiable, tamper-proof infrastructure that operates independently
of centralized authority. We've spent years deploying secure, energy-aware compute in some of the most remote and
adversarial environments on Earth. That work wasn’t just about mining; it was about building systems people could trust
because of how they were built, not who owned them.
That experience is now guiding our approach to AI. Just as countries require their own banking systems, energy grids, and
public health infrastructure, they now require something new: sovereign, deployable AI they can trust.
SHAREHOLDER LETTER Q2 2025 7
Expanding Talent, Connection & Leadership
Our talent acquisition continues to elevate the organization, most recently with the addition of Nir Rikovitch as Chief
Product Officer. Nir brings deep expertise in product management, machine learning, and engineering leadership, with a
proven track record in developing intelligent infrastructure across robotics, industrial automation, and autonomous
systems. His ability to scale real-world technologies will be instrumental as we bring to market transformative solutions at
the intersection of energy, AI, and compute.
This quarter, we also hosted our first hackathon in San Francisco, welcoming 100 participants from top universities and
leading technology companies, including Apple and Nvidia. The teams produced solutions in energy optimization for data
center infrastructure. Events like this help surface practical, real-world solutions that MARA can implement, further
reinforcing our leadership at the intersection of energy and compute .
Finally, we are excited to host our inaugural investor meeting this fall. This event marks an important step in
expanding shareholder engagement and reflects our commitment to education, transparency, and direct communication.
For more details, please contact our Investor Relations team at ir@mara.com.
In Conclusion
As we continue to scale and diversify our business, we believe that MARA’s value extends well beyond any single aspect
of our business. Our vertically integrated mining operations, large BTC treasury, budding international energy partnerships,
and early AI infrastructure investments each contribute distinct and measurable value. When viewed through a sum-of-
the-parts lens, we believe the market has not fully recognized the intrinsic worth and long-term potential of our business.
Our leadership in bitcoin mining is underpinned by our significant BTC holdings, which are more than twice the size of the
next largest miner and continue to drive value for shareholders. This is complemented by a global data center portfolio and
a disciplined energy strategy that lowers costs and improves margins.
Our culture of continuous improvement, supported by top-tier talent, continues to fuel operational progress. Combined
with deepening investor engagement and strong regulatory positioning, we are confident in our ability to execute.
Finally, I would like to recognize and thank our employees for their hard work and dedication this quarter. Their
commitment to excellence continues to be a driving force behind MARA’s progress and long-term success.
Thank you for your continued support and partnership.
Sincerely,

MARA Chairman & CEO
SHAREHOLDER LETTER Q2 2025 8
Second Quarter Financial and Operational Discussion
Highlights
–Record setting quarter in terms of revenues, Adjusted
EBITDA, net income, energized hashrate, fleet efficiency
and blocks produced in a single month.
–Revenues increased 64% to $238.5 million in Q2 2025
from $145.1 million in Q2 2024, the highest revenue
quarter in company history.
–Purchased energy cost per bitcoin declined by 5.6% to
$33,735 since Q1 2025, and cost/kWh was $0.04 for our
owned sites in Q2 2025.
–Cost per petahash per day declined 24% from $37.8 in
Q2 2024 to $28.7 in Q2 2025. We have reduced cost per
petahash per day since the inception of our mining
business in 2021.
–Net income increased 505% to $808.2 million, or $1.84
per diluted share, in Q2 2025 from net loss of ($199.7)
million, or ($0.72) per diluted share, in Q2 2024. Net
income during the quarter includes $1.2 billion gain on
fair value of digital assets.
–Adjusted EBITDA increased to $1.2 billion in Q2 2025
from a $125.5 million loss in Q2 2024.
–For the quarter, total blocks won increased 52% in Q2
2025 to 694 from 457 in Q2 2024. In May, we produced
the largest number of blocks in a single month in our
company's history.
–Energized hashrate increased 82% to 57.4 EH/s in Q2
2025 from 31.5 EH/s in Q2 2024, the highest in company
history. Deployed approximately 30,000 new miners
with current energy efficiency of 18.3 joules per terahash
("J/TH") as of June 2025.
–At June 30, 2025, we held 49,951 BTC (including bitcoin
loaned, actively managed and pledged as collateral).
During Q2 2025, we mined 2,358 BTC.
–Combined unrestricted cash and cash equivalents and
BTC (including loaned, actively managed and pledged as
collateral) of $5.4 billion as of June 30, 2025.
–Subsequent to quarter end, we closed $950.0 million of
upsized 0.00% Convertible Senior Notes due 2032. We
also purchased $19.4 million 1% Senior Notes due 2026 at
a discount for $18.3 million.
–We also granted to the initial purchasers of the notes a
green-shoe option to purchase within a 13-day period
up to an additional $200 million of the notes.
–The additional funds provide us flexibility to strategically
and opportunistically invest in bitcoin, mergers and
acquisitions and/or buying back notes.
–Achieved a trailing twelve-month Adjusted ROCE of 27%,
based on average capital employed of $5.9 billion,
reflecting our capital-efficient reinvestment strategy and
asset-light bitcoin monetization model.
Second Quarter Production Highlight
Prior Quarter Comparison |
|||
Metric |
Q2 2025
|
Q1 2025 |
% Δ |
Number of Blocks Won |
694 |
666 |
4% |
BTC Produced |
2,358 |
2,286 |
3% |
Average BTC Produced per Day |
25.9 |
25.4 |
2% |
Share of Available Miners Rewards (1)
|
5.7% |
5.5% |
N/A |
Energized Hashrate (EH/s) (2)
|
57.4 |
54.3 |
6% |
1.Defined as the total amount of block rewards including transaction fees that MARA earned during the period divided by the total amount of block rewards and transaction fees awarded by the
Bitcoin network during the period.
2.Defined as the amount of hashrate that could theoretically be generated if all miners that have been energized are currently in operation including miners that may be temporarily offline. Hashrates
are estimates based on the manufacturers’ specifications. All figures are rounded.
SHAREHOLDER LETTER Q2 2025 9
REVENUE
Revenues increased 64% to $238.5 million from $145.1
million in the second quarter of 2024, the highest
revenue quarter in company history. The increase was
primarily driven by a 50% increase in the average bitcoin
price, which contributed $76.6 million. We produced an
average of 25.9 BTC each day during the quarter
compared to 22.9 BTC each day in the prior year period,
which resulted in 300 more BTC in the second quarter of
2025 as compared to the prior year period. Furthermore,
we saw a 52% increase in the number of blocks won in
the quarter compared to the second quarter of last year,
with block production in May the highest single month
company history.
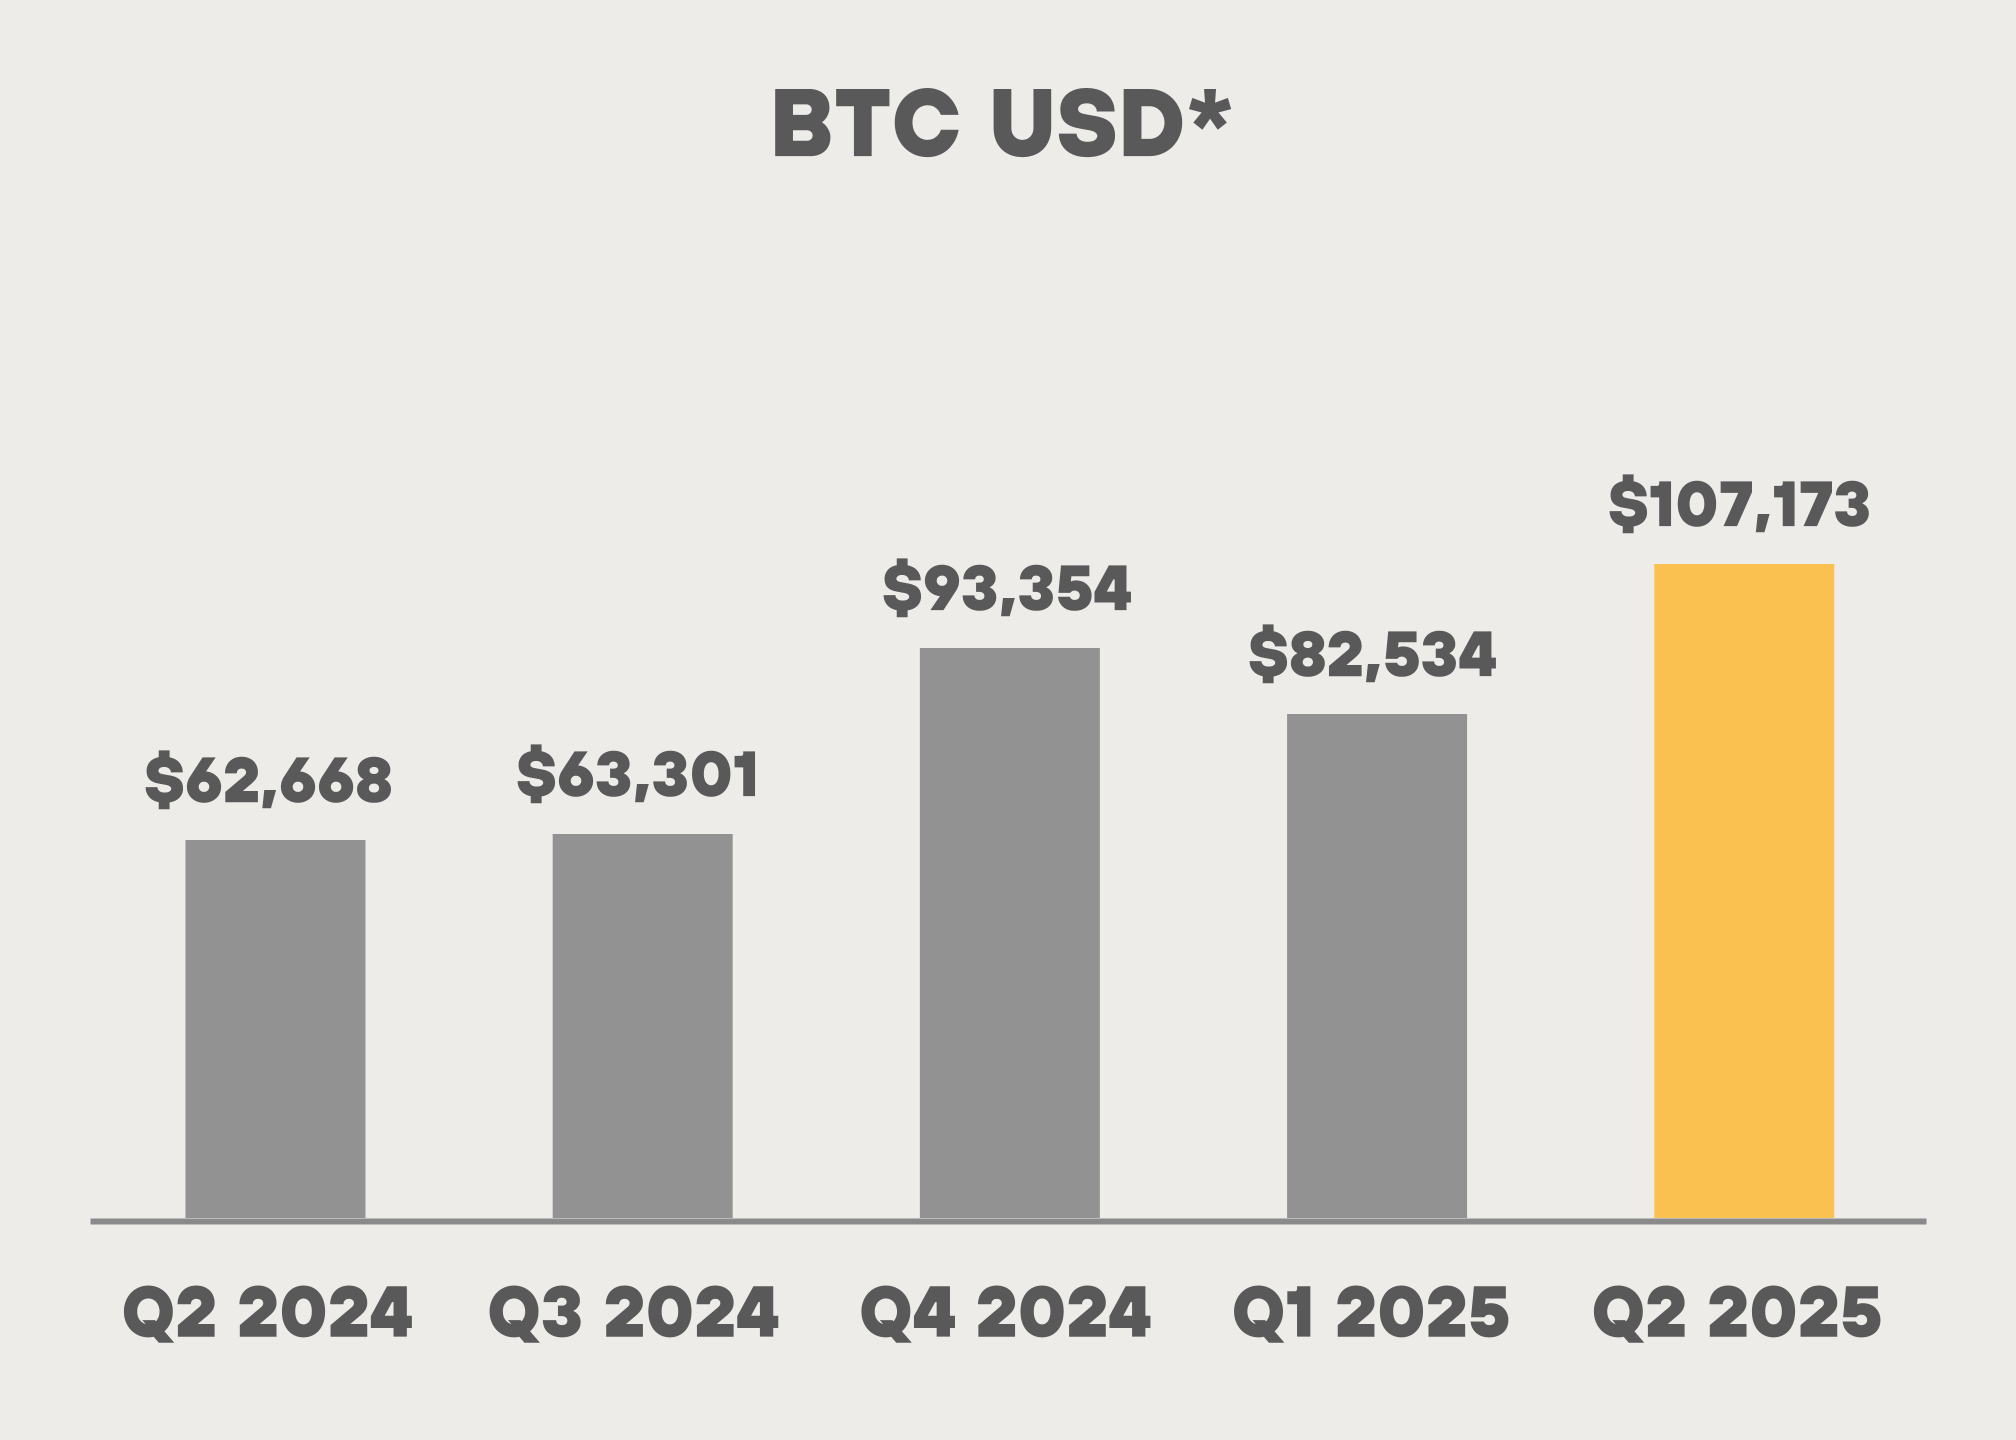
*Price of BTC as of last day of quarter
NET INCOME AND EARNINGS
We reported net income of $808.2 million, or $1.84 per
diluted share, in the quarter compared to net loss of
($199.7) million, or ($0.72) per diluted share, in the
second quarter of last year.
The price of BTC improved on June 30, 2025 versus
March 31, 2025, resulting in earnings being impacted by
a gain on digital assets (including BTC receivable) of $1.2
billion during the second quarter of 2025.
As our bitcoin holdings grow, we expect BTC price
volatility to have a greater impact on our earnings. For
example, a $10,000 change in BTC price would drive a
swing in earnings of nearly $500 million, solely due to
our substantial bitcoin reserves.
SHAREHOLDER LETTER Q2 2025 10
PURCHASED ENERGY COSTS
We define purchased energy costs as the amount paid
to power providers for power consumed related to our
owned bitcoin mining operations. Our purchased energy
costs in the quarter were $41.7 million compared to $26.1
million in the prior year period. The $15.6 million increase
was primarily driven by the expansion of our owned
bitcoin mining operations through acquisitions and a
82% growth in hashrate to 57.4 EH/s.
Our purchase energy cost per bitcoin for owned mining
sites was $33,735 for Q2 2025. Purchased energy costs
per bitcoin is calculated as purchased energy costs
divided by the quantity of bitcoin produced during the
period related to our owned mining operations, and may
fluctuate depending on network difficulty level and/or
seasonal fluctuations in electricity rates.
THIRD-PARTY HOSTING AND OTHER
ENERGY COSTS
Third-party hosting and other energy costs consist of
colocation services related to third-party hosted sites
and energy expenses related to mining other digital
assets. Third-party hosting and other energy costs in the
quarter were $69.0 million compared to $54.0 million in
the prior year period, an increase of $15.0 million. The
increase was primarily due to the addition of energized
miners at third-party hosted facilities. Our pivot from
asset-light to vertically integrated helped to reduce our
electricity cost per coin to one of the lowest in this
sector. As we transition towards a more owned and
operated model, phase out third-party hosted contracts
over time, and bring low-cost sites like wind farms online,
we expect costs on a unit basis to continue to decline.
OPERATING AND MAINTENANCE COSTS
Operating and maintenance costs during the quarter
totaled $22.4 million compared to $15.6 million in the
prior year period, an increase of $6.8 million. The
increase in these costs was primarily due to an increase
in shipping and warehouse fees and site repairs and
maintenance associated with our mining operations.
COST PER PETAHASH
Our cost per petahash per day improved 24% from $37.8
in the second quarter of 2024 to $28.7 dollars per
petahash per day in the second quarter of 2025. Due to
our shift from an asset-light to a vertically integrated
strategy, we believe we are well-positioned to reduce
our operating costs over time as we further expand our
owned initiatives.

+24%

+82%
GENERAL AND ADMINISTRATIVE
In the second quarter of 2025, general and
administrative expenses ("G&A"), excluding stock-based
compensation, was $40.1 million compared with $25.2
million in the prior year period. This increase in expenses
was primarily due to the continued strategic expansion
of our business and our pivot from an asset-light to a
vertically integrated model. The increase reflects the
scaling of our operations, higher personnel costs
associated with headcount growth from 109 employees
at the end of Q2 last year to 201 employees at the end of
SHAREHOLDER LETTER Q2 2025 11
Q2 this year and administrative fees in support of our
expanded footprint.
DEPRECIATION AND AMORTIZATION
Depreciation and amortization in the second quarter was
$161.7 million, a $54.2 million increase from the same
quarter in the prior year. The change was predominantly
the result of deploying additional mining rigs since last
year. Our energized hashrate grew 82% from 31.5 EH/s as
of Q2 2024 to 57.4 EH/s at the end of Q2 2025.
ADJUSTED EBITDA
Primarily due to an increase in revenue, driven by higher
average bitcoin price mined at a lower cost per petahash
per day and an increase in the change in fair value of
digital assets, we reported an Adjusted EBITDA of $1.2
billion compared to an Adjusted EBITDA loss of $125.5
million in the prior year period.
BALANCE SHEET
At quarter end, we held 49,951 bitcoin, including 15,550
bitcoin loaned, actively managed and pledged as
collateral. During Q2 2025, we mined 2,358 BTC. At June
30, 2025, our BTC holdings were valued at
approximately $5.3 billion based on a spot price of
$107,173 per bitcoin.
*including loaned and collateralized BTC
Digging more into our BTC holdings and cash position,
unrestricted cash and cash equivalents totaled $109.5
million, down from $391.8 million as of December 31,
2024. Combined, our balance of cash and BTC (including
bitcoin loaned, actively managed and pledged as
collateral) was approximately $5.4 billion as of June 30,
2025.
*including loaned and collateralized BTC
BITCOIN ASSET MANAGEMENT
As the second largest corporate holders of bitcoin
globally, our strategy is not merely to hold bitcoin
passively, but to create shareholder value through
disciplined, risk-adjusted deployment of our holdings.
We view bitcoin as a productive asset, a source of
liquidity, yield, and long-term capital appreciation.
Our dedicated asset management team, made up of
seasoned professionals with decades of experience in
hedge funds and crypto asset management, actively
manage our BTC to support operations and strategic
growth. By activating a portion of our holdings through
lending, structured trading arrangements, and
collateralized financing, we seek to generate incremental
income that we expect will help fund operations, expand
infrastructure, and reduce our cost of capital. Our
strategy balances upside participation in bitcoin
appreciation with near-term cash flow generation, while
maintaining substantial liquidity to respond to market
opportunities.
Our approach combines the potential for long-term
bitcoin appreciation with disciplined efforts to generate
return while managing risk. To a lesser extent, we have
also used bitcoin as a collateral to borrow under lines of
credit.
As of June 30, 2025, we held a total of 49,951 bitcoin,
including 15,550 bitcoin that were loaned, actively
SHAREHOLDER LETTER Q2 2025 12
managed or pledged as collateral. As such,
approximately 31% of our total holdings were activated
through our bitcoin asset management strategy.
MARA's BTC Holdings | |
Quantity |
|
Bitcoin, unrestricted |
34,401 |
Bitcoin Asset Management |
|
Bitcoin - Loaned |
7,877 |
Bitcoin - Actively Managed |
2,004 |
Bitcoin - Pledged as Collateral |
5,669 |
15,550 |
|
Total |
49,951 |
During the quarter, we entered into a SMA agreement
with an external full-service registered advisor and
transferred 500 bitcoin in mid-May 2025, followed by an
additional 1,500 bitcoin in late June 2025. As of June 30,
2025, a total of 2,004 bitcoin were held and actively
managed within the SMA. The 500 bitcoin transferred in
mid-May 2025 generated an additional 4 bitcoin, or
approximately $0.4 million. We manage the SMA to
generate returns while limiting risk, and it maintains
liquidity with short notice, following an initial one-year
lockup. In addition, our bitcoin asset management team
may, from time to time, engage in various bitcoin
denominated trades such as options, futures, swaps and
spot transactions to generate additional returns on our
bitcoin holdings.
CAPITAL SOURCES
During Q2 2025, we raised $319.3 million from at-the-
market ("ATM") equity sales which we primarily used for
miner purchases, operating costs, acquisition of
infrastructure and for other general corporate purposes.
On July 25, 2025, we closed an upsized $950.0 million of
0.00% Convertible Senior Notes due 2032. This note
carries a 7 year term with 0.0% coupon.
We used approximately $18.3 million of the net proceeds
from the sale of the notes to repurchase approximately
$19.4 million in aggregate principal amount of existing
1.00% convertible senior notes due 2026.
Additionally, we also granted to the initial purchasers of
the notes a green-shoe option to purchase within a 13-
day period up to an additional $200 million aggregate
principal amount of the notes. Per the rules, we are
limited from discussing further until this option period is
over or the option has been exercised.
This additional liquidity gives us the flexibility to act
strategically, whether by acquiring more bitcoin, funding
M&A , or repaying debt. We're under no pressure to
deploy capital immediately; instead we're positioned to
act in response to market conditions in order to maximize
long-term shareholder value. We are different from other
BTC Treasury companies as our core business is Bitcoin
mining and large-scale data center operations, even as
we hold the second largest bitcoin worldwide amongst
public companies.
Looking ahead, what sets us apart is our thought
leadership in compute on the edge, worldwide
operational scale, capital and operational efficiency. As
of June 30, 2025, we held over $5 billion in liquid assets,
with an additional ~$1.0 billion raised since, giving us the
flexibility to fund domestic growth and pursue
international expansion. Unlike passive treasury
companies, we treat our bitcoin as a productive, risk-
managed asset. Through a disciplined asset
management strategy, our holdings strengthen the
balance sheet and help fund operations, which we
believe will enhance long-term shareholder value. We
don't just hold bitcoin, we put it to work.
IN CLOSING
Over the past year, we’ve remained laser-focused on
aligning shareholder interests with bitcoin ownership
through disciplined operational execution. Between Q2
2024 and Q2 2025, our bitcoin holdings surged by over
170%—growing from approximately 18,500 BTC to nearly
50,000 BTC. During the same period, our energized
hashrate expanded by 82%, increasing from 31.5 EH/s to
57.4 EH/s and the market value of our bitcoin holdings
increased by more than $4.2 billion, or 360%, year-over-
year.

MARA Chief Financial Officer
SHAREHOLDER LETTER Q2 2025 13
Earnings Webcast
and Conference Call
MARA will hold a webcast and conference call today,
July 29, 2025, at 5:00 p.m. Eastern time to discuss its
financial results for the quarter ended June 30, 2025.
To register to participate in the conference call or to
listen to the live audio webcast, please use this link. The
webcast will also be broadcast live and available for
replay via the investor relations section of our website.
Earnings Webcast and Conference Call Details
Date: Tuesday, July 29, 2025
Time: 5:00 p.m. Eastern time (2:00 p.m. Pacific
time)
Registration link: LINK
If you have any difficulty connecting with the conference
call, please contact MARA's investor relations team at
ir@mara.com
About MARA
MARA (NASDAQ: MARA) is a vertically integrated digital
energy and infrastructure company that leverages high-
intensity compute, such as bitcoin mining, to monetize
excess energy and optimize power management. We are
focused on two key priorities: strategically growing by
shifting our model toward low-cost energy with more
efficient capital deployment and bringing to market a full
suite of solutions for data centers and edge inference -
including energy management, load balancing and
advanced cooling.
For more information, visit www.mara.com, or follow us
on:
Twitter |
@MARAHoldings |
Linkedin |
MARAHoldings |
Facebook |
MARAHoldings |
Instagram |
@MARAHoldingsinc |
MARA Company Contacts:
Telephone: 1.800.804.1690
Email: ir@mara.com
MARA Media Contact:
Email: mara@wachsman.com
SHAREHOLDER LETTER Q2 2025 14
MARA Holdings, Inc. and Subsidiaries
Condensed Consolidated Statements of Operations (unaudited)
Three Months Ended June 30, |
Six Months Ended June 30, |
|||||||
(in thousands, except share and per share data) |
2025 |
2024 |
2025 |
2024 |
||||
Revenues |
$238,485 |
$145,139 |
$452,369 |
$310,337 |
||||
Costs and operating expenses (income)
|
||||||||
Purchased energy costs |
41,730 |
26,113 |
85,211 |
32,201 |
||||
Third-party hosting and other energy costs |
69,029 |
54,020 |
137,212 |
123,586 |
||||
Operating and maintenance costs |
22,362 |
15,595 |
42,156 |
31,409 |
||||
General and administrative |
92,948 |
53,492 |
178,813 |
122,398 |
||||
Depreciation and amortization |
161,741 |
107,508 |
319,638 |
189,110 |
||||
Change in fair value of digital assets |
(846,027) |
147,999 |
(451,865) |
(340,808) |
||||
Change in fair value of derivative instrument |
(20,311) |
(38,251) |
(47,139) |
(22,999) |
||||
Impairment of assets |
26,253 |
— |
26,253 |
— |
||||
Taxes other than on income |
2,437 |
1,555 |
5,532 |
4,065 |
||||
Early termination expenses |
— |
5,660 |
— |
27,757 |
||||
Research and development |
8,546 |
3,845 |
17,844 |
6,311 |
||||
Total costs and operating expenses (income)
|
(441,292) |
377,536 |
313,655 |
173,030 |
||||
Operating income (loss)
|
679,777 |
(232,397) |
138,714 |
137,307 |
||||
Other income
|
||||||||
Change in fair value of digital assets - receivable, net |
346,547 |
— |
230,480 |
— |
||||
Interest income |
9,631 |
2,308 |
21,626 |
4,881 |
||||
Interest expense |
(12,835) |
(1,369) |
(22,776) |
(2,625) |
||||
Equity in net earnings of unconsolidated affiliate |
(902) |
49 |
(915) |
1,308 |
||||
Other |
(5,509) |
93 |
(3,035) |
3,037 |
||||
Total other income
|
336,932 |
1,081 |
225,380 |
6,601 |
||||
Income (loss) before income taxes
|
1,016,709 |
(231,316) |
364,094 |
143,908 |
||||
Income tax benefit (expense)
|
(208,504) |
31,657 |
(89,332) |
(6,394) |
||||
Net income (loss)
|
$808,205 |
$(199,659) |
$274,762 |
$137,514 |
||||
Less: net loss attributable to noncontrolling interest
|
30 |
— |
274 |
— |
||||
Net income (loss) attributable to common stockholders
|
$808,235 |
$(199,659) |
$275,036 |
$137,514 |
||||
Net income (loss) per share of common stock - basic
|
$2.29 |
$(0.72) |
$0.79 |
$0.51 |
||||
Weighted average shares of common stock - basic |
352,901,683 |
278,674,506 |
348,524,166 |
268,899,932 |
||||
Net income (loss) per share of common stock - diluted
|
$1.84 |
$(0.72) |
$0.64 |
$0.50 |
||||
Weighted average shares of common stock - diluted |
440,912,159 |
278,674,506 |
436,271,805 |
277,959,660 |
||||
SHAREHOLDER LETTER Q2 2025 15
Three Months Ended June 30, |
Six Months Ended June 30, |
|||||||
(in thousands, except share and per share data) |
2025 |
2024 |
2025 |
2024 |
||||
Reconciliation to Adjusted EBITDA: |
||||||||
Net income (loss) attributable to common stockholders
|
$808,235 |
$(199,659) |
$275,036 |
$137,514 |
||||
Interest expense (income), net
|
3,204 |
(939) |
1,150 |
(2,256) |
||||
Income tax expense (benefit)
|
208,504 |
(31,657) |
89,332 |
6,394 |
||||
Depreciation and amortization |
164,914 |
111,047 |
325,916 |
195,232 |
||||
EBITDA |
1,184,857 |
(121,208) |
691,434 |
336,884 |
||||
Stock based compensation expense |
54,656 |
28,332 |
103,771 |
80,245 |
||||
Change in fair value of derivative instrument |
(20,311) |
(38,251) |
(47,139) |
(22,999) |
||||
Impairment of assets |
26,253 |
— |
26,253 |
— |
||||
Net gain on investments |
— |
— |
(12,429) |
(5,236) |
||||
Early termination expenses |
— |
5,660 |
— |
27,757 |
||||
Adjusted EBITDA (1)
|
$1,245,455 |
$(125,467) |
$761,890 |
$416,651 |
||||
Three Months Ended |
||||||||||
(in thousands, except return on capital employed) |
June 30, 2025 |
March 31,
2025
|
December 31,
2024
|
September
30, 2024
|
June 30, 2024 |
|||||
Reconciliation of last twelve month ("LTM") net income to LTM Adjusted EBITDA (2):
| ||||||||||
Net income (loss) attributable to common
stockholders
|
$678,775 |
$(329,119) |
$541,253 |
$164,551 |
$288,950 |
|||||
Interest income, net |
(309) |
(4,452) |
(3,715) |
(4,068) |
(406) |
|||||
Income tax expense (benefit) |
158,433 |
(81,728) |
75,495 |
(26,692) |
22,542 |
|||||
Depreciation and amortization |
572,238 |
518,371 |
441,554 |
372,749 |
321,814 |
|||||
EBITDA |
1,409,137 |
103,072 |
1,054,587 |
506,540 |
632,900 |
|||||
Stock based compensation expense |
181,168 |
154,844 |
157,642 |
122,322 |
104,493 |
|||||
Change in fair value of derivative instrument |
(22,097) |
(40,037) |
2,043 |
35,235 |
(22,999) |
|||||
Impairment of assets |
26,253 |
— |
— |
— |
— |
|||||
Net gain on investments |
(13,121) |
(11,429) |
(4,236) |
(4,236) |
(5,236) |
|||||
Net gain from extinguishment of debt |
(11,429) |
(13,121) |
(13,121) |
— |
(82,600) |
|||||
Early termination expenses |
10,304 |
15,964 |
38,061 |
38,061 |
27,757 |
|||||
Adjusted EBITDA |
$1,580,215 |
$209,293 |
$1,234,976 |
$697,922 |
$654,315 |
|||||
LTM total assets |
$6,136,839 |
$4,985,767 |
$4,113,902 |
$2,911,316 |
$2,362,224 |
|||||
Less: LTM total current liabilities |
241,094 |
155,642 |
81,332 |
65,972 |
60,568 |
|||||
Average capital employed |
$5,895,745 |
$4,830,125 |
$4,032,570 |
$2,845,344 |
$2,301,656 |
|||||
Return on capital employed (1)
|
27% |
4% |
31% |
25% |
28% |
|||||
SHAREHOLDER LETTER Q2 2025 16
(1) Non-GAAP Financial Measures. In order to provide a more
comprehensive understanding of the information used by our
management team in financial and operational decision-making, we
supplement our Condensed Consolidated Financial Statements that
have been prepared in accordance with generally accepted
accounting principles in the United States ("GAAP") with the non-
GAAP financial measures of Adjusted EBITDA and return on capital
employed .
The Company defines Adjusted EBITDA as (a) GAAP net income (loss)
attributable to common stockholders plus (b) adjustments to add back
the impacts of (1) interest, (2) income taxes, (3) depreciation and
amortization and (4) adjustments for non-cash and/or non-recurring
items, which currently include (i) stock compensation expense, (ii)
change in fair value of derivative instrument, (iii) impairment of assets,
(iv) gain on investments and (v) early termination expenses. The
Company defines return on capital employed as (a) the average trailing
four quarters' Adjusted EBITDA divided by (b) average capital
employed calculated by averaging the trailing four quarters of total
assets less current liabilities.
Management uses Adjusted EBITDA and return on capital employed,
along with the supplemental information provided herein, as a means
of understanding, managing and evaluating business performance and
to help inform operating decision-making. The Company relies
primarily on its Condensed Consolidated Financial Statements to
understand, manage and evaluate its financial performance and uses
non-GAAP financial measures only supplementally.
We believe that adjusted EBITDA and return on capital employed are
useful measures to us and to our investors because they exclude
certain financial, capital structure and/or non-cash items that we do
not believe directly reflect our core operations and may not be
indicative of our recurring operations, in part because they may vary
widely across time and within our industry independent of the
performance of our core operations. We believe that excluding these
items enables us to more effectively evaluate our performance period-
over-period and relative to our competitors.
Adjusted EBITDA and return on capital employed are not recognized
financial measures under GAAP. When analyzing our operating results,
investors should use them in addition to, but not as an alternative for,
the most directly comparable financial results calculated and
presented in accordance with GAAP. Because our calculation of these
non-GAAP financial measures may differ from that of other companies,
our presentation of these measures may not be comparable to similarly
titled measures of other companies.
(2) Last twelve months ("LTM") net income and Adjusted EBITDA
represent the summation of each of the financial measures for the
quarters ended June 30, 2025, March 31, 2025, December 31, 2024,
September 30, 2024 and June 30, 2024.
SHAREHOLDER LETTER Q2 2025 17
Investor Notice
Investing in our securities involves a high degree of risk. Before making an investment decision, you should carefully
consider the risks, uncertainties and forward-looking statements described under the heading “Risk Factors” in our most
recent annual report on Form 10-K and any other periodic reports that we may file with the U.S. Securities and Exchange
Commission (the “SEC”). If any of these risks were to occur, our business, financial condition or results of operations would
likely suffer. In that event, the value of our securities could decline, and you could lose part or all of your investment. The
risks and uncertainties we describe are not the only ones facing us. Additional risks not presently known to us or that we
currently deem immaterial may also impair our business operations. In addition, our past financial performance may not be
a reliable indicator of future performance, and historical trends should not be used to anticipate results in the future. See
“Forward-Looking Statements” below.
Forward-Looking Statements
This press release contains forward-looking statements within the meaning of the federal securities laws. All statements,
other than statements of historical fact, included in this press release are forward-looking statements. The words “may,”
“will,” “could,” “anticipate,” “expect,” “intend,” “believe,” “continue,” “target” and similar expressions or variations or
negatives of these words are intended to identify forward-looking statements, although not all forward-looking statements
contain these identifying words. Such forward-looking statements include, among other things, statements related to our
strategy, future operations, growth targets, developing technologies and expansion into adjacent markets. Such forward-
looking statements are based on management’s current expectations about future events as of the date hereof and
involve many risks and uncertainties that could cause our actual results to differ materially from those expressed or implied
in our forward-looking statements. Subsequent events and developments, including actual results or changes in our
assumptions, may cause our views to change. We do not undertake to update our forward-looking statements except to
the extent required by applicable law. Readers are cautioned not to place undue reliance on such forward-looking
statements. All forward-looking statements included herein are expressly qualified in their entirety by these cautionary
statements. Our actual results and outcomes could differ materially from those included in these forward-looking
statements as a result of various factors, including, but not limited to, the factors set forth under the heading “Risk Factors”
in our most recent annual report on Form 10-K and any other periodic reports that we may file with the SEC.