EX-99.1
Published on February 26, 2026


The financial results discussed in this letter are preliminary, unaudited, and subject to the completion of our year-end closing
procedures and audit. Final results will be provided in our Annual Report on Form 10-K for the year ended December 31, 2025.
Key Highlights |
Revenues decreased 6% to $202.3 million |
IN Q4 2025 |
from $214.4 million in Q4 2024. |
Net income (loss) decreased to ($1.7 billion) |
IN Q4 2025 |
from $528.5 million in Q4 2024. |
Adjusted EBITDA decreased to ($1.5 billion) |
IN Q4 2025 |
compared to $796.0 million in Q4 2024. |
Cost/petahash per day decreased by 4% |
IN Q4 2025 |
from Q4 2024. |
Energized hashrate ("EH/s") increased 25% |
TO 66.4 EH/S IN Q4 2025 |
from 53.2 EH/s in Q4 2024. |
Bitcoin holdings increased 20% |
TO 53,822 BTC (C. $4.7B) |
Including 15,315 BTC loaned or pledged as collateral as of December 31, 2025. |
Total blocks won decreased 15% to 595 |
IN Q4 2025 |
from 703 in Q4 2024. |
Purchased energy cost per BTC $48,611 |
IN Q4 2025 |
for our owned sites. |
Cost per kWh: $0.05 |
FOR Q4 2025. |
Mined 2,011 BTC and purchased 1,670 BTC |
IN Q4 2025. |
SHAREHOLDER LETTER Q4 2025 3
To Our Shareholders |
This quarter, we are accelerating MARA’s expansion into AI and high-performance compute with the
announcement of our strategic joint venture with Starwood Digital Ventures (“Starwood”).
This partnership marks an important step forward in the evolution of our platform and reflects the
intentional transformation of our business from a pure-play Bitcoin miner into an energy and digital
infrastructure company.
Under the partnership, MARA and Starwood will develop, finance and operate next-
generation digital infrastructure capable of meeting growing demand from enterprise,
hyperscale, and AI customers across MARA’s existing power-rich portfolio. MARA will
contribute dedicated, energy-advanced data center sites, while Starwood will lead design,
development, tenant sourcing, construction, and facility operation, with Starwood providing
investment expertise to support enhanced project level economics.
To ensure successful execution, we believe it is critical to partner with best-in-class operators.
Starwood brings proven development execution, financing capability, and established relationships
with prospective tenants, complementing MARA’s energized sites, and flexible compute
infrastructure.
We believe partnering with Starwood positions MARA to participate meaningfully in the highest
demand segments of the data center market, including enterprise, hyperscale and AI, where
institutional credibility, development certainty, and tenant relationships are decisive competitive
advantages.
This partnership is designed to be capital-efficient and strategically flexible.
Unlike traditional data center development models, this partnership, and MARA’s modular approach,
will allow us to scale selectively, playing directly to our core strengths. This structure is designed to
allow MARA to continue mining operations where capacity is available at attractive power costs.
MARA will have the option to invest up to 50 percent in joint venture projects, enabling us
to retain ownership in assets generating operating cash flow while maintaining exposure to
long-term value creation. The joint platform is expected to support more than 1 gigawatt
(“GW”) of IT capacity in the initial development phase, with a development roadmap that
could extend capacity beyond 2.5 GW over time.
Bitcoin mining remains an integral part of this model, continuing to serve as a flexible, always-on
workload that monetizes power while higher-value compute capacity is developed and deployed.
This collaboration represents the next logical step in MARA’s deliberate, multi-year transformation.
MARA’s strategy has continuously adapted to where value accrues within digital infrastructure.
SHAREHOLDER LETTER Q4 2025 4
Early on, scale, and installed capacity defined competitiveness, leading to an asset-light model. Over
time, it became clear that infrastructure control and operational execution drive durable value,
particularly as energy constraints tightened. This conviction led us to prioritize site ownership and
power control. As AI workloads gained traction, we recognized that long-term economics would
concentrate at the inference layer rather than in hosting alone, prompting us to expand our
capabilities. Infrastructure drives scale; enterprise deployment drives margin.
In 2025, as HPC conversions accelerated and inbound interest from hyperscalers increased, we saw
clear strategic value in our owned sites. That perspective ultimately led to today’s announcement with
Starwood Digital Ventures, ensuring quality tenancy and disciplined development while preserving
long-term value for our shareholders.
The Next Decade
Looking ahead, we believe the next decade of digital infrastructure will be shaped less by compute
availability and more by energy constraints. AI adoption is accelerating faster than grids can expand.
Interconnection queues are lengthening, power costs are rising, and access to reliable, scalable
energy has become the binding constraint for AI and high-performance compute.
This dynamic fundamentally reshapes where value is created.
We believe MARA is strategically advantaged in this environment. We control power-rich sites
located at critical intersections of generation, transmission, and load. Our infrastructure is modular,
scalable, and designed to support multiple workloads. Because our sites are already energized, we
can deploy capacity on timelines measured in months rather than years, and at economics that reflect
energy ownership rather than grid scarcity pricing.
Advancing Our Digital Energy and Compute Platform
We are positioning our platform to support a broad range of AI deployment requirements, from
large‑scale cloud environments to private, enterprise and sovereign deployments, particularly where
data residency, latency, and operational control requirements limit public cloud use.
2025 was a year of deliberate investment and foundation building for our next phase of growth. Our
actions throughout the year were guided by a clear set of priorities: accumulating and controlling low-
cost, utility-scale power; preserving flexibility in how that power is monetized; and maintaining
disciplined capital allocation. Against this framework, we put essential building blocks in place to
evolve into a next-generation digital infrastructure platform integrating Bitcoin mining, power
generation, AI, and high-performance compute.
MARA’s strategy is a value-creation stack built on power ownership.
As demand emerges, we will selectively convert capacity to higher-value workloads, including AI
inference and high-performance compute, deploying capital only where we believe returns justify
investment. Over time, this layered approach will allow MARA to allocate energy to its highest-value
SHAREHOLDER LETTER Q4 2025 5
application as market conditions evolve, compounding asset value while preserving optionality across
cycles.
That progress is already visible. We closed our investment in Exaion, expanding our capabilities
and positioning MARA to participate directly in sovereign-grade AI and high-performance
computing opportunities. While Starwood enables hyperscale infrastructure development, Exaion
enables the enterprise and sovereign deployment layer of AI.
Exaion is part of our broader international strategy to position MARA as a power-
advantaged digital infrastructure platform beyond the United States. Building on our proven
success in the UAE and the recent launch of our pilot site in Oman, we are advancing
discussions with major energy companies in France regarding global opportunities, including
in Brazil, as well as domestic energy producers in Saudi Arabia. These initiatives reflect a
disciplined approach to expanding our global footprint across energy-rich regions where
access to reliable, scalable power supports long-term infrastructure development.
We also increased our footprint in Nebraska through the acquisition of a 42-megawatt data center
adjacent to an existing site. With attractive power rates, we expect this acquisition to lower our
average cost to mine at our Nebraska campus while strengthening our owned infrastructure footprint
and providing option value for future AI and HPC workloads.
We have also secured nearly 2 gigawatts of capacity through ownership and long-term contractual
rights and are strengthening durability by bringing generation in-house. This includes our owned wind
farm and our NGON gas-to-power operations, which doubled from 25 megawatts to 50 megawatts
during the quarter. These assets support lower-cost mining operations while reducing emissions.
Given the recent decline in Bitcoin price and impact of our joint venture with Starwood, which we
believe will be accretive, we are prioritizing capital allocation toward the highest-value near-term
opportunities. While we continue to advance discussions with MPLX regarding the development of
integrated power and data campuses in West Texas, this remains a longer-term initiative that would
require significant capital investment. Although the scope under consideration has evolved from the
initial letter of intent, we remain actively engaged in evaluating a transaction structure that aligns with
our disciplined capital allocation strategy.
Bitcoin and Long‑Term Value Creation
Bitcoin remains a core pillar of MARA’s strategy.
Bitcoin mining provides a distinctly flexible, industrial-scale use of electricity that allows us to
monetize stranded and underutilized power while supporting grid stability. Despite recent market
volatility, we increased energized hashrate from 53.2 EH/s to 66.4 EH/s during the year. While below
our 75 EH/s target, this outcome reflects deliberate capital discipline. We chose not to deploy capital
into new builds that failed to meet our return thresholds, instead focusing on optimization – improving
SHAREHOLDER LETTER Q4 2025 6
uptime, maintenance efficiency, and productivity across our existing fleet. We expect these efficiency
gains to strengthen unit economics and improve resilience across market cycles.
Our bitcoin holdings also represent a liquid balance sheet asset that provides strategic optionality and
liquidity management flexibility. While the timing of a recovery in bitcoin prices is difficult to predict,
our long-term conviction in the asset class remains unchanged. We believe that recent volatility
reflects broader macro uncertainty rather than a deterioration in bitcoin’s underlying fundamentals.
Looking forward
MARA has evolved far beyond the asset-light, hosted model of its past. Today, we operate a vertically
integrated portfolio spanning power and compute at scale. Power ownership guides every decision
we make, from capital allocation and partnerships to organizational design. Bitcoin mining remains the
backbone of our enterprise, distinctly capable of monetizing energy at scale, while AI and advanced
compute extend the durability and flexibility of the platform.
We view 2026 as an inflection point. With infrastructure in place, upgrades underway, the Starwood
partnership advancing select assets toward hyperscale tenancy, and Exaion expanding our enterprise
AI capabilities, we are positioned to execute on our strategy. Together, Starwood and Exaion
represent complementary components of a unified strategy: one converts energy into contracted
hyperscale infrastructure value; the other converts energy into enterprise-grade AI services and
integration margin. Both provide us long-term demand visibility, disciplined development execution,
and a clear path to cash flow while preserving long-term optionality.
Our focus remains absolute: operational delivery, disciplined capital allocation, and directing energy to
its highest-value use. Supported by partners like Starwood that bring scale, credibility, and proven
execution, we believe MARA is distinctly positioned to deliver durable, long-term returns for our
shareholders.
Sincerely,

MARA Chairman & CEO
SHAREHOLDER LETTER Q4 2025 7
Fourth Quarter and Full Year 2025 Financial and Operational Discussion |
Highlights
–As of December 31, 2025, we delivered record energized
hashrate of 66.4 EH/s, increasing 25% from 53.2 EH/s as
of December 31, 2024.
–Revenues decreased 6% to $202.3 million in Q4 2025
from $214.4 million in Q4 2024. For 2025, revenues grew
38% to $907.1 million from $656.4 million in 2024.
–Our cost per kWh was $0.04 for our owned sites in 2025.
Purchased energy cost per bitcoin was $48,611 in Q4
2025, up from $31,608 in Q4 2024.
–Cost per petahash per day was $30.5 for Q4 2025, a
slight decline of 4% from Q3 2025 and improved 16% for
the full year in 2025.
–Net loss was ($1.7 billion), or ($4.52) per diluted share, in
Q4 2025 compared to net income of $528.3 million, or
$1.24 per diluted share, in Q4 2024. Net loss during the
quarter includes a ($1.5 billion) loss on fair value of digital
assets. Full year net loss was ($1.3 billion) compared to
net income of $541.0 million in 2024
–Adjusted EBITDA was ($1.5 billion) in Q4 2025, compared
to $796.0 million in Q4 2024, primarily due to a decrease
in the fair value of our bitcoin holdings. Full year adjusted
EBITDA was ($330.8 million), compared to adjusted
EBITDA of $1.2 billion in the prior year.
–Total blocks won decreased 15% in Q4 2025 to 595 from
703 in Q4 2024. For the full year, blocks won grew 21% to
2,588 from 2,132 in 2024.
–Deployed approximately 35,000 new miners with
current energy efficiency of 18.6 joules per terahash ("J/
TH") as of December 31, 2025.
–At December 31, 2025, we held 53,822 BTC (including
digital assets - receivable, net). During Q4 2025, we
mined 2,011 BTC, for a total of 8,799 mined during the
year.
–Combined unrestricted cash and cash equivalents and
BTC (including bitcoin loaned or pledged as collateral) of
$5.3 billion as of December 31, 2025.
–First quarter since 2022 with no at-the-market offering
program ("ATM") usage.
–Acquired a 42 MW operational data center in central
Nebraska, expected to lower our average mining costs at
our Nebraska campus.
–Acquired a 64% stake in Exaion to expand our AI and
HPC infrastructure capabilities.
–Activated 15,315 BTC under our digital asset
management strategy, generating approximately
$32.1 million of interest income for the year ended
December 31, 2025.
–Announced a joint venture with Starwood to develop AI
and HPC infrastructure at select power-rich sites across
our existing portfolio.
Fourth Quarter and Full Year 2025 Production Highlights
Prior Quarter Comparison | Year-over-Year Comparison | |||||
Metric | Q4 2025 | Q3 2025 | % Δ | FY2025 | FY2024 | % Δ |
Number of Blocks Won | 595 | 633 | (6%) | 2,588 | 2,132 | 21% |
BTC Produced | 2,011 | 2,144 | (6%) | 8,799 | 9,430 | (7%) |
Average BTC Produced per Day | 21.9 | 23.3 | (6%) | 24.1 | 25.8 | (7%) |
Share of Available Miners Rewards (1) | 4.8% | 5.0% | N/A | 5.3% | 4.1% | N/A |
Energized Hashrate (EH/s) (2) | 66.4 | 60.4 | 10% | 66.4 | 53.2 | 25% |
1.Defined as the total amount of block rewards including transaction fees that MARA earned during the period divided by the total amount of block rewards and transaction fees awarded by
the Bitcoin network during the period.
2.Defined as the amount of hashrate that could theoretically be generated if all miners that have been energized are currently in operation including miners that may be temporarily offline.
Hashrates are estimates based on the manufacturers’ specifications. All figures are rounded.
SHAREHOLDER LETTER Q4 2025 8
The financial results discussed in this letter are preliminary,
unaudited, and subject to the completion of our year-end
closing procedures and audit. Final results will be provided in
our Annual Report on Form 10-K for the year ended December
31, 2025.
REVENUE
Our revenues decreased 6% to $202.3 million from
$214.4 million in the fourth quarter of 2024. The decrease
was primarily driven by a 14% decrease in the average
price of bitcoin mined over the quarter.
For the year ended December 31, 2025, we generated
revenues of $907.1 million, compared to $656.4 million in
the prior year. The $250.7 million, or approximately 38%,
increase in revenues, was primarily driven by a 53%
increase in the average price of bitcoin mined, which
contributed $301.4 million. This was partially offset by a
$28.4 million decrease in bitcoin production and a $22.3
million decrease in other revenue, primarily reflecting
revenue from hosting services in the prior year period.
We produced an average of 21.9 BTC each day during
the fourth quarter of 2025, compared to 27.1 BTC each
day during the prior year period, which resulted in 481
less BTC mined in the fourth quarter of 2025 compared
to the prior year period. In 2025, we produced 8,799 BTC
compared to 9,430 in 2024. Furthermore, we saw a 15%
decrease in the number of blocks won in the quarter
compared to the fourth quarter of last year.
*Price of BTC as of last day of quarter
NET INCOME (LOSS)
We reported net loss of ($1.7 billion), or ($4.52) per
diluted share, in the fourth quarter of 2025, compared to
net income of $528.3 million, or $1.24 per diluted share, in
the fourth quarter of 2024.
For the full year, we recorded net loss of ($1.3 billion),
compared to net income of $541.0 million in the prior
year. The ($1.9 billion) decrease in net income (loss) was
primarily driven by a ($1.5 billion) decrease in operating
income, largely due to higher depreciation and
amortization expense, including from accelerated
depreciation of $772.8 million, unfavorable bitcoin mark-
to-market adjustments of $425.7 million, and impairment
of goodwill of $82.8 million.
The price of BTC declined from September 30, 2025 to
December 31, 2025, resulting in net income (loss) being
SHAREHOLDER LETTER Q4 2025 9
negatively impacted by a change in fair value of digital
assets (including digital assets - receivable, net) of ($1.5
billion) during the fourth quarter of 2025.
PURCHASED ENERGY COSTS
We define purchased energy costs as the amount paid
to power providers for power consumed related to our
owned Bitcoin mining operations. Our purchased energy
costs in the fourth quarter of 2025 were $50.8 million,
compared to $39.0 million in the prior year period. For
the year ended December 31, 2025, our purchased
energy costs were $179.0 million, compared to $98.2
million in the prior year. The increases were primarily
driven by the expansion of our owned mining sites and a
25% increase in our total hashrate to 66.4 EH/s.
Our cost per kWh was $0.04 for our owned sites in 2025.
Purchased energy cost per bitcoin for our owned and
operated sites was $48,611 in Q4 2025, compared to
$31,608 in Q4 2024. The increase was primarily due to
higher global network difficulty, which outpaced our
hashrate growth and reduced bitcoin mined per unit of
energy. The increase in power costs was largely driven
by seasonal factors and adverse weather events.
OPERATING AND MAINTENANCE COSTS
Operating and maintenance costs during the fourth
quarter of 2025 totaled $27.5 million compared to $23.1
million in the prior year period, an increase of $4.5 million.
Operating and maintenance costs during 2025 totaled
$96.0 million, compared to $63.8 million in 2024, an
increase of $32.2 million. The increase was primarily due
to higher shipping and warehouse fees and increased
labor costs from our mining operations.
THIRD-PARTY HOSTING AND OTHER
ENERGY COSTS
Third-party hosting and other energy costs consist of co-
location services related to third-party hosted sites and
energy expenses related to mining digital assets other
than bitcoin. Third-party hosting and other energy costs
in the fourth quarter of 2025 were $79.4 million,
compared to $70.0 million in the prior year period, an
increase of $9.4 million. For the full year, third-party
hosting and other energy costs were $292.2 million
compared to $257.3 million in 2024, an increase of $35.0
million. These increases were primarily driven by an
opportunistic deployment of more mining rigs at certain
hosted sites.
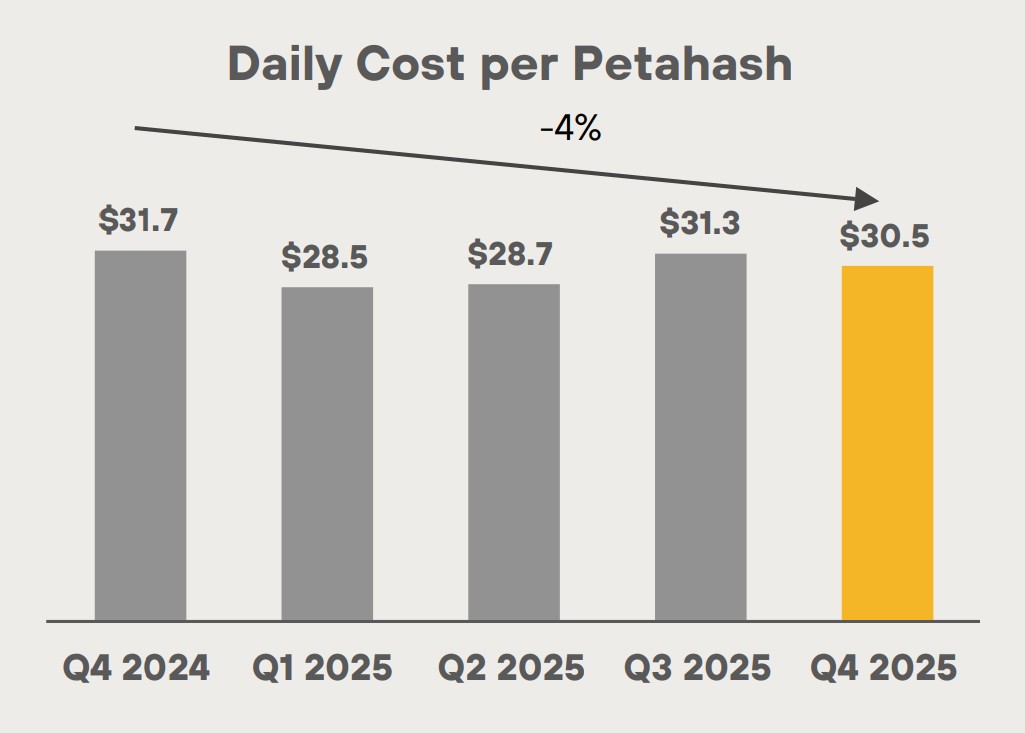
COST PER PETAHASH
Our cost per petahash per day improved 4% from $31.7 in
the fourth quarter of 2024 to $30.5 per petahash per day
SHAREHOLDER LETTER Q4 2025 10
in the fourth quarter of 2025. Over the past 11 quarters,
our cost per petahash has improved by 36%.
-4%

GENERAL AND ADMINISTRATIVE
In the fourth quarter of 2025, general and administrative
("G&A") expenses, excluding stock-based compensation,
were $56.6 million, compared to $18.8 million in the prior
year period. For the full year, G&A expenses, excluding
stock-based compensation, were $181.3 million,
compared to $96.3 million in 2024. The increase reflects
the scaling of our operations, higher personnel costs
associated with headcount growth, and administrative
*including BTC loaned, actively managed or pledged as collateral
fees in support of our expanded global footprint.
DEPRECIATION AND AMORTIZATION
Depreciation and amortization in the fourth quarter of
2025 was $285.8 million, a $147.6 million increase
compared to the prior year period. Depreciation and
amortization for the year ended December 31, 2025
totaled $772.8 million, compared to $429.2 million in
2024. The $343.6 million, or approximately 80%, increase
was primarily due to the deployment of additional mining
rigs and an overall expansion in the scale of our business.
The increase also reflects $110.5 million of accelerated
depreciation of certain mining rigs.
ADJUSTED EBITDA
Adjusted EBITDA in the fourth quarter of 2025 was ($1.5
billion), compared to $796.0 million in the prior year
period. Adjusted EBITDA was ($330.8 million) for the
year ended December 31, 2025, compared to $1.2 billion
*including BTC loaned, actively managed and pledged as collateral
in the prior year. While fourth quarter 2025 revenue
declined modestly compared to the prior year period, the
decrease in bitcoin price led to a significant negative
change in the fair value of digital assets, compounded by
higher purchased energy costs, for both the fourth
quarter and the full year.
BALANCE SHEET
At year end, we held 53,822 bitcoin, including 15,315
bitcoin loaned or pledged as collateral. During Q4 2025,
we mined 2,011 BTC. As of December 31, 2025, our BTC
holdings were valued at approximately $4.7 billion based
on a spot price of $87,498 per bitcoin.
Unrestricted cash and cash equivalents totaled $547.1
million as of December 31, 2025, up from $391.8 million in
the prior year. Combined, our balance of cash and BTC
(including bitcoin loaned or pledged as collateral) was
approximately $5.3 billion at year end.
SHAREHOLDER LETTER Q4 2025 11
DIGITAL ASSET MANAGEMENT
As of December 31, 2025, we held a total of 53,822
bitcoin, including 15,315 bitcoin that were loaned or
pledged as collateral. As such, approximately 28% of our
total holdings were activated through our digital asset
management strategy. Under our lending arrangements,
a total of 9,377 bitcoin were loaned to counterparties,
generating approximately $32.1 million of interest income
during the year.
MARA's BTC Holdings | |
As of December 31, 2025 | Quantity |
Bitcoin, unrestricted | 38,507 |
Bitcoin - Receivable | |
Bitcoin - Loaned | 9,377 |
Bitcoin - Pledged as Collateral | 5,938 |
15,315 | |
Total | 53,822 |
In the second quarter, we entered into a separately
managed account ("SMA") agreement with an external
registered investment advisor. For the year ended
December 31, 2025, the SMA incurred a net loss of
approximately $22.1 million. In December 2025, we
terminated the agreement and withdrew the remaining
bitcoin from the SMA.
Historically, we held the bitcoin we produced as a long-
term investment. In the second half of 2025, we began
selling bitcoin to fund operations. In 2026, we expect to
continue to monetize bitcoin opportunistically to
enhance our financial flexibility, including to provide
liquidity or to fund capital projects and other initiatives
that we believe enhance long-term shareholder value,
subject to market conditions and our capital allocation
priorities.
CAPITAL SOURCES
In response to the more volatile pricing environment, we
elected to suspend use of our ATM in the fourth quarter
and instead funded operations through the sale of a
portion of our mined bitcoin. Notably, this marked the
first quarter since 2022 that we did not utilize our ATM.
In 2025, we raised $568.6 million from ATM sales, which
we primarily used for miner purchases, operating costs,
acquisition of infrastructure, and for other general
corporate purposes. As of December 31, 2025, we held
$5.3 billion in liquid assets.

MARA Chief Financial Officer
SHAREHOLDER LETTER Q4 2025 12
Earnings Webcast and Conference Call |
MARA will hold a webcast and conference call today,
February 26, 2026, at 5:00 p.m. Eastern Time (2:00 p.m.
Pacific Time) to discuss its financial results for the
quarter and fiscal year ended December 31, 2025.
To register to participate in the conference call or to
listen to the live audio webcast, please use this link. The
webcast will also be broadcast live and available for
replay via the investor relations section of our website.
Earnings Webcast and Conference Call Details
Date: Thursday, February 26, 2026
Time: 5:00 p.m. Eastern Time (2:00 p.m. Pacific
Time)
Registration link: LINK
If you have any difficulty connecting with the conference
call, please contact MARA's investor relations team at
ir@mara.com
About MARA
MARA (NASDAQ: MARA) is an energy and digital
infrastructure company that deploys digital energy
technologies to advance the world’s energy systems.
Harnessing the power of compute, MARA transforms
excess energy into digital capital, balancing the grid and
accelerating the deployment of critical infrastructure.
Building on its expertise to redefine the future of energy,
MARA develops technologies that reduce the energy
demands of high-performance computing applications,
from AI to the edge.
For more information, visit www.mara.com, or follow us
on:
X | @MARA |
LinkedIn | MARAHoldings |
Facebook | MARAHoldings |
Instagram | @MARAHoldingsInc |
MARA Company Contacts:
Telephone: 1.800.804.1690
Email: ir@mara.com
MARA Media Contact:
Email: mara-jf@joelefrank.com
SHAREHOLDER LETTER Q4 2025 13
MARA Holdings, Inc. and Subsidiaries
Consolidated Statements of Operations (unaudited)
Three Months Ended December 31, | Year Ended December 31, | |||||||
(in thousands, except share and per share data) | 2025 | 2024 | 2025 | 2024 | ||||
Revenues | $202,314 | $214,394 | $907,093 | $656,378 | ||||
Costs and operating expenses (income) | ||||||||
Purchased energy costs | 50,750 | 38,971 | 179,041 | 98,160 | ||||
Operating and maintenance costs | 27,518 | 23,054 | 95,984 | 63,828 | ||||
Third-party hosting and other energy costs | 79,367 | 69,996 | 292,243 | 257,276 | ||||
General and administrative | 85,832 | 72,822 | 349,941 | 253,964 | ||||
Depreciation and amortization | 285,818 | 138,216 | 772,768 | 429,185 | ||||
Change in fair value of digital assets | 990,732 | (442,918) | 304,627 | (813,814) | ||||
Change in fair value of derivative instrument | 2,345 | (33,192) | (40,372) | 2,043 | ||||
Impairment of goodwill and other assets | 82,777 | — | 109,030 | — | ||||
Taxes other than on income | 1,282 | 2,313 | 9,168 | 8,335 | ||||
Early termination expenses | — | — | 5,000 | 38,061 | ||||
Research and development | 3,557 | 4,105 | 30,117 | 13,229 | ||||
Restructuring costs | 2,891 | — | 23,796 | — | ||||
Total costs and operating expenses (income) | 1,612,869 | (126,633) | 2,131,343 | 350,267 | ||||
Operating income (loss) | (1,410,555) | 341,027 | (1,224,250) | 306,111 | ||||
Other income (loss) | ||||||||
Change in fair value of digital assets - receivable, net | (460,381) | 299,796 | (121,042) | 299,796 | ||||
Interest income | 16,540 | 7,936 | 55,855 | 16,711 | ||||
Interest expense | (12,845) | (8,029) | (48,381) | (12,996) | ||||
Equity in net earnings of unconsolidated affiliate | (2,073) | (680) | (4,699) | (1,505) | ||||
Other | (23,860) | (6,626) | (26,780) | (4,735) | ||||
Total other income (loss) | (482,619) | 305,518 | (144,018) | 310,392 | ||||
Income (loss) before income taxes | (1,893,174) | 646,545 | (1,368,268) | 616,503 | ||||
Income tax benefit (expense) | 183,386 | (118,262) | 56,376 | (75,495) | ||||
Net income (loss) | $(1,709,788) | $528,283 | $(1,311,892) | $541,008 | ||||
Less: net loss attributable to noncontrolling interest | 144 | 245 | 412 | 245 | ||||
Net income (loss) attributable to common stockholders | $(1,709,644) | $528,528 | $(1,311,480) | $541,253 | ||||
Net income (loss) per share of common stock - basic | $(4.52) | $1.36 | $(3.69) | $1.87 | ||||
Weighted average shares of common stock - basic | 378,607,810 | 388,689,395 | 355,167,578 | 289,961,989 | ||||
Net income (loss) per share of common stock - diluted | $(4.52) | $1.24 | $(3.69) | $1.72 | ||||
Weighted average shares of common stock - diluted | 378,607,810 | 419,880,332 | 355,167,578 | 311,841,347 | ||||
SHAREHOLDER LETTER Q4 2025 14
Three Months Ended December 31, | Year Ended December 31, | |||||||
(in thousands, except share and per share data) | 2025 | 2024 | 2025 | 2024 | ||||
Reconciliation to Adjusted EBITDA: | ||||||||
Net income (loss) attributable to common stockholders | $(1,709,644) | $528,528 | $(1,311,480) | $541,253 | ||||
Interest expense (income), net | (3,695) | 93 | (7,474) | (3,715) | ||||
Income tax expense (benefit) | (183,386) | 118,262 | (56,376) | 75,495 | ||||
Depreciation and amortization | 289,960 | 141,355 | 786,397 | 441,554 | ||||
EBITDA | (1,606,765) | 788,238 | (588,933) | 1,054,587 | ||||
Stock-based compensation expense | 30,058 | 54,057 | 172,295 | 157,642 | ||||
Change in fair value of derivative instrument | 2,345 | (33,192) | (40,372) | 2,043 | ||||
Impairment of goodwill and other assets | 82,777 | — | 109,030 | — | ||||
Restructuring costs | 2,891 | — | 23,796 | — | ||||
Acquisition and integration costs | 530 | — | 2,005 | — | ||||
Net gain from extinguishment of debt | — | (13,121) | (1,029) | (13,121) | ||||
Net gain on investments | (187) | — | (12,616) | (4,236) | ||||
Early termination expenses | — | — | 5,000 | 38,061 | ||||
Adjusted EBITDA (1) | $(1,488,351) | $795,982 | $(330,824) | $1,234,976 | ||||
Three Months Ended | ||||||||||
(in thousands, except return on capital employed) | December 31, 2025 | September 30, 2025 | June 30, 2025 | March 31, 2025 | December 31, 2024 | |||||
Reconciliation of last twelve month ("LTM") net income to LTM Adjusted EBITDA (2): | ||||||||||
Net income (loss) attributable to common stockholders | $(1,311,480) | $926,692 | $678,775 | $(329,119) | $541,253 | |||||
Interest income, net | (7,474) | (3,686) | (309) | (4,452) | (3,715) | |||||
Income tax expense (benefit) | (56,376) | 245,272 | 158,433 | (81,728) | 75,495 | |||||
Depreciation and amortization | 786,397 | 637,792 | 572,238 | 518,371 | 441,554 | |||||
EBITDA | (588,933) | 1,806,070 | 1,409,137 | 103,072 | 1,054,587 | |||||
Stock-based compensation expense | 172,295 | 196,294 | 181,168 | 154,844 | 157,642 | |||||
Change in fair value of derivative instrument | (40,372) | (75,909) | (22,097) | (40,037) | 2,043 | |||||
Impairment of goodwill and other assets | 109,030 | 26,253 | 26,253 | — | — | |||||
Restructuring costs | 23,796 | 20,905 | — | — | — | |||||
Acquisition and integration costs | 2,005 | 1,475 | — | — | — | |||||
Net gain on investments | (12,616) | (12,429) | (11,429) | (11,429) | (4,236) | |||||
Net gain from extinguishment of debt | (1,029) | (14,150) | (13,121) | (13,121) | (13,121) | |||||
Early termination expenses | 5,000 | 5,000 | 10,304 | 15,964 | 38,061 | |||||
Adjusted EBITDA | $(330,824) | $1,953,509 | $1,580,215 | $209,293 | $1,234,976 | |||||
LTM total assets | $7,651,541 | $7,530,146 | $6,136,839 | $4,985,767 | $4,113,902 | |||||
Less: LTM total current liabilities | 447,659 | 340,990 | 241,094 | 155,642 | 81,332 | |||||
Average capital employed | $7,203,882 | $7,189,156 | $5,895,745 | $4,830,125 | $4,032,570 | |||||
Return on capital employed (1) | (5)% | 27% | 27% | 4% | 31% | |||||
SHAREHOLDER LETTER Q4 2025 15
(1) Non-GAAP Financial Measures. In order to provide a more
comprehensive understanding of the information used by our
management team in financial and operational decision-making, we
supplement our Consolidated Financial Statements that have been
prepared in accordance with generally accepted accounting principles
in the United States ("GAAP") with the non-GAAP financial measures of
Adjusted EBITDA and Return on Capital Employed .
The Company defines Adjusted EBITDA as GAAP net income (loss)
attributable to common stockholders plus adjustments to add back the
impacts of (1) interest, (2) income taxes, (3) depreciation and
amortization and (4) adjustments for non-cash and/or non-recurring
items, which currently include (i) stock-based compensation expense,
(ii) change in fair value of derivative instrument, (iii) impairment of
goodwill and other assets, (iv) restructuring costs, (v) acquisition and
integration costs, (vi) net gain from extinguishment of debt, (vii) net
gain (loss) on investments and (viii) early termination expenses. The
Company defines Return on Capital Employed as (a) the average
Adjusted EBITDA for the trailing four quarters divided by (b) average
capital employed, calculated by averaging the trailing four quarters of
total assets less current liabilities.
Management uses Adjusted EBITDA and Return on Capital Employed,
together with the supplemental information provided herein, to
understand, manage and evaluate business performance and to inform
operating decision-making. The Company relies primarily on its
Consolidated Financial Statements to evaluate financial performance
and uses non-GAAP financial measures only supplementally.
We believe that Adjusted EBITDA and Return on Capital Employed are
useful to us and to our investors because they exclude certain financial,
capital structure and/or non-cash items that we do not believe directly
reflect our core operations or may not be indicative of our recurring
operations. These items may vary significantly over time and across
companies within our industry independent of core operating
performance. We believe that excluding these items allows for more
meaningful period-over-period comparisons and improved
comparability relative to other companies.
Adjusted EBITDA and Return on Capital Employed are not recognized
financial measures under GAAP. Investors should consider these
measures in addition to, but not as a substitute for, the most directly
comparable financial results calculated and presented in accordance
with GAAP. Because our calculation of these non-GAAP financial
measures may differ from that of other companies, our presentation of
these measures may not be comparable to similarly titled measures of
other companies.
(2) Last twelve months ("LTM") net income and Adjusted EBITDA
represent the sum of the respective financial measures for the quarters
ended December 31, 2025, September 30, 2025, June 30, 2025, March
31, 2025 and December 31, 2024.
SHAREHOLDER LETTER Q4 2025 16
Investor Notice
Investing in our securities involves a high degree of risk. Before making an investment decision, you should carefully
consider the risks, uncertainties and forward-looking statements described under the heading "Risk Factors" in our most
recent annual report on Form 10-K and any other periodic reports that we may file with the U.S. Securities and Exchange
Commission (the "SEC"). If any of these risks were to occur, our business, financial condition or results of operations would
likely suffer. In that event, the value of our securities could decline, and you could lose part or all of your investment. The
risks and uncertainties we describe are not the only ones facing us. Additional risks not presently known to us or that we
currently deem immaterial may also impair our business operations. In addition, our past financial performance may not be
a reliable indicator of future performance, and historical trends should not be used to anticipate results in the future. See
"Forward-Looking Statements" below.
Forward-Looking Statements |
This shareholder letter contains forward-looking statements within the meaning of the federal securities laws. All
statements, other than statements of historical fact, included in this shareholder letter are forward-looking statements.
The words "may," "will," "could," "anticipate," "expect," "intend," "believe," "continue," "target" and similar expressions or
variations or negatives of these words are intended to identify forward-looking statements, although not all forward-
looking statements contain these identifying words. Such forward-looking statements include, among other things,
statements relating to our strategic joint venture with Starwood, including the structure, timing and expected benefits of
the partnership; plans to develop, finance and operate digital infrastructure projects; our ability to fund, scale and allocate
capital to joint venture projects; expected demand from enterprise, hyperscale and AI customers; expansion into artificial
intelligence, inference and high-performance compute; anticipated benefits of our investment in Exaion; and potential
domestic and international expansion opportunities. Such forward-looking statements are based on management's
current expectations about future events as of the date hereof and involve many risks and uncertainties that could cause
our actual results to differ materially from those expressed or implied in our forward-looking statements. Subsequent
events and developments, including actual results or changes in our assumptions, may cause our views to change. We do
not undertake to update our forward-looking statements except to the extent required by applicable law. Readers are
cautioned not to place undue reliance on such forward-looking statements. All forward-looking statements included
herein are expressly qualified in their entirety by these cautionary statements. Our actual results and outcomes could differ
materially from those included in these forward-looking statements as a result of various factors, including, but not limited
to, the factors set forth under the heading "Risk Factors" in our most recent annual report on Form 10-K and any other
periodic reports that we may file with the SEC.