EX-99.1
Published on May 9, 2025
Exhibit 99.1

| Contents | |
| To Our Shareholders | 3 |
| Financial and Operational Discussion | 7 |
| Earnings Webcast and Conference Call | 12 |
| Statements of Operations | 13 |
| Investor Notice | 15 |
| Forward-Looking Statements | 15 |

Key Highlights
|
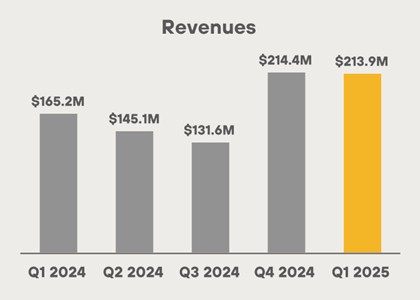
Revenues increased 30% to $213.9 million
|
| IN Q1 2025 |
| from $165.2 million in Q1 2024. |
|
Net income (loss) decreased 258%
|
| TO $(533.4) MILLION |
| in Q1 2025 from $337.2 million in Q1 2024. |
|
Adjusted EBITDA decreased 189%
|
| $(483.6) MILLION |
| compared to $542.1 million in Q1 2024. |
|
Cost/petahash per day improved by 25%
|
| IN Q1 2025 |
| from Q1 2024. |
|
Energized hashrate (“EH/s”) increased 95%
|
| TO 54.3 EH/S IN Q1 2025 |
| from 27.8 EH/s in Q1 2024. |
|
Bitcoin holdings increased 174%
|
| TO 47,531 BTC (C. $3.9B) |
| Including loaned and collateralized bitcoin, at March 31, 2025, of which approximately 14,269 BTC was loaned to third parties or utilized as collateral for borrowings, generating additional return. |
|
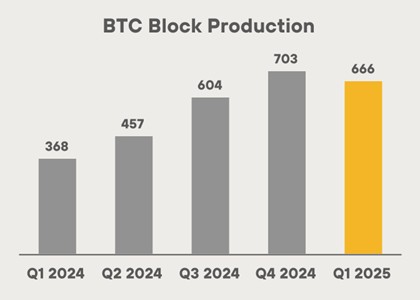
Total blocks won increased 81% to 666
|
| IN Q1 2025 |
| from 368 in Q1 2024. |
|
Purchased energy cost per BTC: $35,728 and cost per kWh: $0.04
|
| IN Q1 2025 |
| for our owned sites |
|
We had a BTC yield per share of 3.5%
|
| FOR Q1 2025 |
|
Mined 2,286 BTC and purchased 340 BTC
|
| IN Q1 2025 |
 |
SHAREHOLDER LETTER Q1 2025 | 3 |
Global markets have had a volatile start to the year. Major equity indices like the Nasdaq and S&P 500 have pulled back much of the momentum they gained in the lead-up to President Trump’s inauguration, primarily due to ongoing global trade uncertainty and the Federal Reserve holding interest rates steady.
And yet, amidst the turbulence, bitcoin (“bitcoin” or “BTC”) has shown remarkable resilience. Gold has acted as a flight-to-safety asset historically, and we believe bitcoin will follow a similar trajectory as more investors begin to share our view of its potential as the most optimal macro hedge in uncertain environments.
Our stock tends to move with the overall mood of the market, especially how investors feel about bitcoin. When bitcoin is up and market
sentiment is strong, we usually see positive momentum in our stock performance. But in risk-off environments, our stock often trades
down with the rest of the sector—even when our fundamentals remain solid. This correlation primarily stems from the close relationship
between bitcoin’s price and broad sentiment toward miners.
Some of our competitors have publicly announced plans to limit mining growth or pivot toward hosting and AI-GPU operations, while others are expanding by staying grid-attached and investing in new machines, making them less capital efficient. Meanwhile, we’re forging ahead, staying true to our strategy. We remain laser-focused on transforming MARA into a vertically integrated digital energy and infrastructure company. We believe this model gives us tighter operational control, improves cost-efficiency, and makes us more resilient to shifts in the broader economy.
To achieve this transformation, we are focused on two key priorities:
(1) strategically growing by shifting our model toward low-cost energy with more efficient capital deployment, and
(2) bringing to market a full suite of solutions for data centers and edge inference—including energy management, load balancing, and advanced cooling.
1. Strategically Growing by Shifting Our Model Toward Low-Cost Energy with More Efficient Capital Deployment
We are a growth company, but not at any cost. Our goal isn’t to chase an arbitrary EH/s number. Given the lack of visibility in the current market environment, setting rigid EH/s targets isn’t prudent or in the best interest of our shareholders. It invites short-term thinking and encourages the wrong kind of growth.
In 2025, that means expanding domestically and internationally. We will maintain discipline in how and where we scale to maximize profitability, extend our energy relationships, and drive capital efficiency. The power industry has woken up to the benefits of bitcoin mining as a flexible load. A recent Duke University study finds that flexible loads can be curtailed when necessary to help absorb new power demand without infrastructure expansion, allowing at least 76 GW of new load (equal to 10% of the nation’s peak demand) to be integrated with just 0.25% annual curtailment. Bitcoin mining fits this model well, providing utilities with a scalable, controllable load that can improve grid efficiency and stability.
Amid the industry’s growing recognition for addressing critical energy challenges, MARA stands at the forefront. MARA was the only Bitcoin miner at the first-ever White House Crypto Summit and the only one to testify in front of Congress — a clear sign we’re seen as a leading voice in the industry. We have invested over $2 billion across Texas, Nebraska, and Ohio—creating local jobs and supporting local supplier spending. Our operations provide high-paying tech jobs, engage small businesses through contracts and services, and help stabilize energy markets while driving meaningful economic development in the communities we serve.
|
SHAREHOLDER LETTER Q1 2025 | 4 |
We are currently in discussions for public-private partnerships and with energy companies across the U.S., Europe, and the Middle East. Rather than hastily pursuing speculative deployments, we’re investing in regions where energy is abundant, policy is favorable, and our business is further vertically integrated.
Longer term, we still anticipate a 50/50 global fleet split between U.S.-based and international sites. This mix will allow us to diversify geopolitical risk and open new opportunities in emerging economies around the world.
Driving Capital and Operational Efficiency
Our goal is simple: maximize returns while minimizing costs. That means increasing return on capital employed (“ROCE”), reducing direct energy costs, and lowering cost per petahash.
In Q1, we delivered:
| ● | Purchased energy cost per BTC of $35,728 |
| ● | Daily cost per petahash of $28.5 |
Here’s how we achieved that progress:
| ● | In February, we closed the acquisition of a 114 MW wind farm in Texas. This asset enables us to generate power at low cost for a behind-the-meter data center, with expected fixed costs of ~$10/MWh, and once the site has established a grid connection, less than $30/MWh. Building a data center at the wind farm will be more economical than building a greenfield site because the infrastructure (e.g., substations) is already in place. We expect to build the data center for $150-250/kWh, approximately 60% less than a potential new site build. Additionally, by pairing low cost renewable energy with previous generation ASICs that would’ve otherwise been retired, we’re extending their useful life while revitalizing the energy asset. |
| ● | We fully energized our 25 MW gas-to-power operations across wellheads in North Dakota and Texas. These sites currently provide us with our lowest cost per BTC mined while monetizing excess gas and mitigating methane emissions for the producers. We achieve this low cost by generating our own electricity, converting up to ~5,000 MCF (thousand cubic feet) of gas daily – at full capacity – into power for our modular data centers. In the first six months of operation, we reduced a net total of 61,143 metric tons of CO₂ equivalent methane, or ~14,200 gasoline-powered vehicles off the road for a full year, according to EPA equivalency data. This project was fully energized at the start of Q2 2025. |
| ● | Lastly, we completed a 50 MW expansion at our fully owned data center in Ohio, bringing total operational capacity to 100 MW, with the site designed to scale up to 200 MW. Additionally, we installed over 12,000 S21 Pro miners at the location. Construction was completed in Q2 2025. |
Through owning infrastructure, self-generating power, extending asset longevity, and managing costs, we are driving capital and operational efficiency across our business. Whether through renewables, natural gas, or heat recapture, we’re building toward a future with low production costs.
|
SHAREHOLDER LETTER Q1 2025 | 5 |
2. Advancing Research and Development of Digital Energy Technologies
MARA is investing in and developing digital energy technologies, which can both improve the efficiency of our operations and diversify our revenue streams. From chips to cooling infrastructure and software, we’re building the systems that will power the next generation of high-performance, energy-efficient computing.
ASIC Chips: Auradine
We’re a seed investor in Auradine, a U.S.-based ASIC chip manufacturer. In April, we participated in their latest funding round, strengthening our access to domestic silicon supply.
Auradine gives us a strategic edge:
| ● | More efficiency: Enhances our operations with next-generation chip technology that reduces power consumption. |
| ● | More customization: We can tune the chips to our operating environment, controlling voltage, frequency, and firmware to maximize performance. We are now producing our own next-gen miners using Auradine chips and ramping production through the balance of the year. This provides us with lower cost, higher performance, technology independence and a more resilient supply chain. |
| ● | More resilience: Domestic supply reduces exposure to shipping delays and geopolitical risk. |
Cooling Infrastructure: 2PIC
Our internally developed two-phase immersion cooling (“2PIC”) systems are now being deployed. A 30 MW pilot is underway, and we remain on track to share market feedback on 2PIC’s performance and optimizing mining efficiency in the second half of the year.
We believe 2PIC is essential for the future of high-density efficient computing. Our 2PIC systems deliver better thermal performance, reduce space footprint, and use zero water. 2PIC is built for modularity, making it an ideal complement for both Bitcoin mining and emerging AI compute workloads.
Software: MARA Pool
By operating our own mining pool, we keep 100% of transaction fees and capture higher revenue by including non-standard transactions. Since launch, MARA Pool’s block reward luck has outperformed the network average by over 10%, contributing to our industry-leading block production.
|
SHAREHOLDER LETTER Q1 2025 | 6 |
Positioning for the next wave of AI and beyond
While we remain focused on Bitcoin mining, our infrastructure is already aligned with the next wave of compute demand, which we extensively covered in our prior letter. We’re positioning MARA to support AI inference workloads - which require low latency, have unpredictable energy demands, and are spread out geographically - and we are in advanced discussions with several compute OEMs to roll out pilot deployments this year. We believe our immersion-cooled, modular data centers are well-suited to address the needs of this emerging trend.
We are also piloting at our own sites an integrated tech solution for balancing data centers, supporting high frequency response times for load smoothing. As this tech becomes ready for market, we will make more formal announcements.
2025 is an important year for MARA as we transform into a vertically integrated digital energy and infrastructure company.
In Q1, we took steps to further progress with our vertically integrated model. We reduced costs and demonstrated we can design, build, and operate efficient infrastructure powered by self-owned energy. Additionally, we executed across both of our strategic priorities: growing with discipline while improving capital and operational efficiency, and investing in research and development to extend our technological capabilities. We believe that staying steadfast to our strategy will, in time, lead to greater value creation for our shareholders.
As we mentioned in our last letter, our themes this year are to generate, activate, and differentiate. We continue to believe the companies that will succeed in our industry will generate their own energy, activate new services by leveraging infrastructure and technology, and strategically differentiate themselves from the rest.
Thank you for your support as we continue our transformation. We’ve come a long way, but this is only the beginning. We’re on a mission to advance the world’s energy systems.
Sincerely,
____________________________________

MARA Chairman & CEO
|
SHAREHOLDER LETTER Q1 2025 | 7 |
First Quarter Financial and Operational Discussion
Highlights
| – | Effective Q1 2025, we made certain changes to the presentation of our income statement to provide more meaningful information regarding the nature of our operating expenses and to align the presentation with the evolving nature of our operations. |
| – | Revenues increased 30% to $213.9 million in Q1 2025 from $165.2 million in Q1 2024. |
| – | Our purchased energy cost per bitcoin was $35,728 and cost/kWh was $0.04 for our owned sites in Q1 2025. |
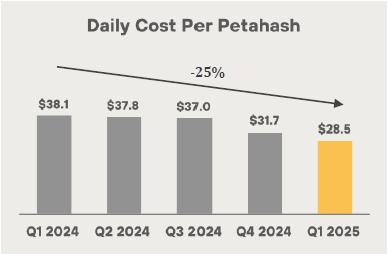
| – | Cost per petahash per day improved 25% from $38.1 in Q1 2024 to $28.5 dollar per petahash per day in Q1 2025 |
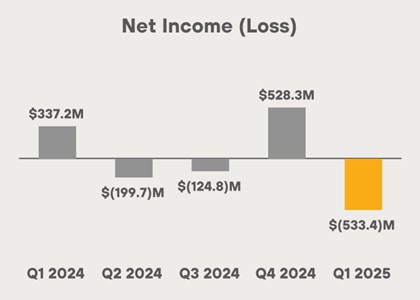
| – | Net income (loss) decreased 258% to $(533.4) million, or $(1.55) per diluted share, in Q1 2025 from net income of $337.2 million, or $1.26 per diluted share, in Q1 2024. Net income (loss) includes $510.2 million loss on fair value of digital assets. |
| – | Adjusted EBITDA decreased to a loss of $(483.6) million in Q1 2025 from $542.1 million in Q1 2024. |
| – | For the quarter, total blocks won increased 81% in Q1 2025 to 666 from 368 in Q1 2024. |
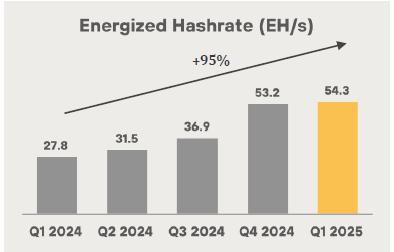
| – | Energized hashrate increased 95% to 54.3 EH/s in Q1 2025 from 27.8 EH/s in Q1 2024. Deployed 20,000 new miners with current energy efficiency of 19.3 joules per terahash (“J/TH”) as of March 2025. |
| – | At March 31, 2025, we held 47,531 BTC (including loaned and collateralized BTC). During Q1 2025, we mined 2,286 BTC. At March 31, 2025, we had a BTC yield per share of 3.5%. |
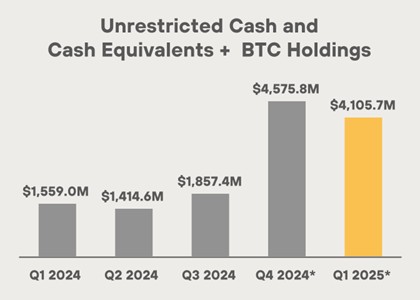
| – | Combined unrestricted cash and cash equivalents and BTC (including loaned and collateralized BTC) of $4.1 billion as of March 31, 2025. |
| – | In Q1 2025, we acquired the wind farm in Texas, at an average price of ~$205,000 per MW, for current and planned capacity of 240 MW once fully energized. |
| – | Although we recognized a loss in Q1 based on a quarter-end Bitcoin price of $82,534, the current bitcoin price of approximately $100,000 would imply a substantial fair value gain in excess of the fair market value loss recognized in Q1 2025. |
First Quarter Production Highlight
| Prior Quarter Comparison | ||||||||||||
| Metric | Q1 2025 | Q4 2024 | % Δ | |||||||||
| Number of Blocks Won | 666 | 703 | (5 | )% | ||||||||
| BTC Produced | 2,286 | 2,492 | (8 | )% | ||||||||
| Average BTC Produced per Day | 25.4 | 27.1 | (6 | )% | ||||||||
| Share of Available Miners Rewards (1) | 5.5 | % | 5.6 | % | N/A | |||||||
| Energized Hashrate (EH/s) (2) | 54.3 | 53.2 | 2 | % | ||||||||
| 1. | Defined as the total amount of block rewards including transaction fees that MARA earned during the period divided by the total amount of block rewards and transaction fees awarded by the Bitcoin network during the period. |
| 2. | Defined as the amount of hashrate that could theoretically be generated if all miners that have been energized are currently in operation including miners that may be temporarily offline. Hashrates are estimates based on the manufacturers’ specifications. All figures are rounded. |
|
SHAREHOLDER LETTER Q1 2025 | 8 |
REVENUE
Revenues increased 30% to $213.9 million from $165.2 million in the first quarter of 2024. The increase was primarily driven by a 77% increase in the average bitcoin price, which contributed $90.7 million, partially offset by a $21.8 million decrease in bitcoin production due to halving.
We produced an average of 25.4 BTC each day during the quarter compared to 30.9 BTC each day in the prior year period, which resulted in 525 less BTC in the first quarter of 2025 as compared to the prior year period. Despite lower production, we saw an 81% increase in number of blocks won in the quarter compared to the first quarter of last year.
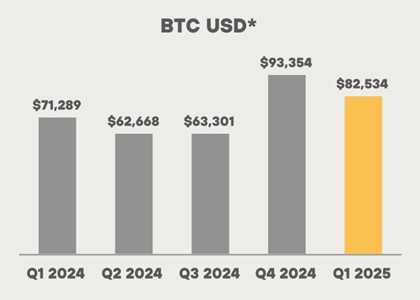
*Price of BTC as of last day of quarter
NET LOSS AND EARNINGS
We reported net loss of $(533.4) million, or $(1.55) per diluted share, in the quarter compared to net income of $337.2 million, or $1.26 per diluted share, in the first quarter of last year.
The price of BTC declined on March 31, 2025 versus December 31, 2024, resulting in earnings being impacted by a loss on digital assets (including BTC receivable) of $510.2 million during the first quarter of 2025. This was partially offset by an increase in revenue and margin due to a higher bitcoin price during the quarter versus the prior year period.
|
SHAREHOLDER LETTER Q1 2025 | 9 |
Although we recognized a loss in Q1 based on a quarter-end BTC price of $82,534, the current BTC price of approximately $100,000 would imply a substantial fair value gain.
As our bitcoin holdings grow, we expect BTC price volatility to have a greater impact on our earnings. For example, a $10,000 change in BTC price would drive a swing in earnings of nearly $500 million, solely due to our substantial bitcoin reserves.
PURCHASED ENERGY COSTS
We define purchased energy costs as the amount paid to power providers for power consumed related to our owned bitcoin mining operations. Our purchased energy costs in the quarter were $43.5 million compared to $6.1 million in the prior year period. The $37.4 million increase was primarily driven by the expansion of our owned bitcoin mining operations through acquisitions and a 95% growth in hashrate to 54.3 EH/s.
Our purchase energy cost per bitcoin for owned mining sites was $35,728 for Q1 2025. Purchased energy cost per bitcoin is calculated as purchased energy costs divided by the quantity of bitcoin produced during the period related to our owned mining operations, and may fluctuate depending on network difficulty level and/or seasonal fluctuations in electricity rates.
THIRD PARTY HOSTING AND OTHER ENERGY COSTS
Third party hosting and other energy costs consist of colocation services related to third-party hosted sites and energy expenses related to mining other digital assets. Third party hosting and other energy costs in the quarter were $68.2 million compared to $69.6 million in the prior year period, a decrease of $1.4 million. The decrease was primarily due to a decrease in hosting related operating costs due to our pivot towards an owned and operated model, and unexpected equipment downtime at a third-party hosted site in the prior year period, offset by an increase in energized miners at third party hosted facilities.
OPERATING AND MAINTENANCE COSTS
Operating and maintenance costs during the quarter totaled $19.8 million compared to $15.8 million in the prior year period, an increase of $4.0 million. The increase in these costs was primarily due to an increase in shipping and warehouse fees and site repairs and maintenance associated with our mining operations.
COST PER PETAHASH
Our cost per petahash per day improved 25% from $38.1 in the first quarter of 2024 to $28.5 dollar per petahash per day in the first quarter of 2025. Sequentially, we improved this cost from $31.7 in Q4 2024, reflecting a 10% improvement despite a higher difficulty level to mine due to a higher global hashrate. Due to our shift from an asset-light to a vertically integrated strategy, we believe we are well-positioned to reduce our operating costs over time as we further expand our owned initiatives.
|
SHAREHOLDER LETTER Q1 2025 | 10 |
GENERAL AND ADMINISTRATIVE
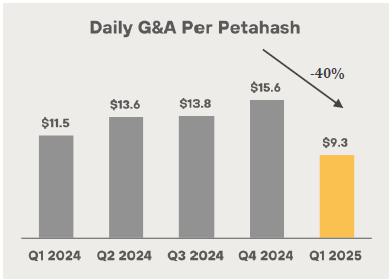
In the first quarter of 2025, general and administrative expenses (“G&A”), excluding stock-based compensation, was $36.9 million compared with $17.0 million in the prior year period. This increase in expenses was primarily due to the increasing scale of the business and acquisitions, an increase in professional and legal fees and an increase in headcount from 72 employees at the end of Q1 last year to approximately 171 employees at the end of Q1 this year. We expect to continue funding diversified growth initiatives as we scale. Finally, G&A per petahash declined 40% sequentially in Q1 2025 and almost 20% year-over-year as we deployed more efficient miners and our hashrate grew 2% during the quarter.
DEPRECIATION AND AMORTIZATION
Depreciation and amortization in the first quarter was $157.9 million, a $76.3 million increase from the same quarter in the prior year. The change was predominantly the result of deploying additional mining rigs since last year. Our energized hashrate grew 95% from 27.8 exahash as of Q1 2024 to 54.3 exahash at the end of Q1 2025.
ADJUSTED EBITDA
Primarily due to an increase in revenue, driven by higher average bitcoin price mined at a lower cost per petahash per day, offset by a decrease in the change in fair value of digital assets and a higher G&A expense excluding stock-based compensation, we reported an Adjusted EBITDA loss of $(483.6) million compared to an Adjusted EBITDA income of $542.1 million in the prior year period.
BALANCE SHEET AND TREASURY MANAGEMENT
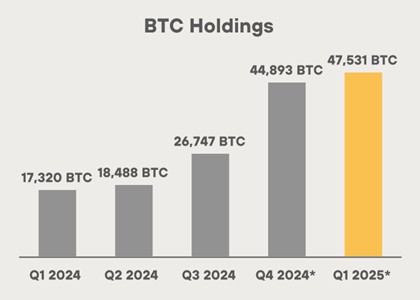
At quarter end, we held 47,531 bitcoin (including loaned and collateralized bitcoin). During Q1 2025, we mined 2,286 BTC and purchased 340 BTC using cash on hand. At March 31, 2025, our BTC holdings were valued at approximately $3.9 billion based on a spot price of $82,534 per bitcoin. As of March 31, 2025, we had a bitcoin yield per share of 3.5%.
*including loaned and collateralized BTC
Digging more into our BTC holdings and cash position, unrestricted cash and cash equivalents totaled $196.2 million, down from $391.8 million as of December 31, 2024. Combined, our balance of cash and BTC (including loaned and collateralized bitcoin) was approximately $4.1 billion as of March 31, 2025.
|
SHAREHOLDER LETTER Q1 2025 | 11 |
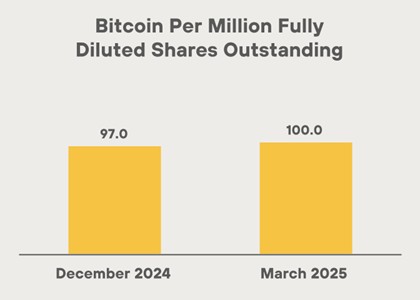
Our treasury management strategy and opportunistic BTC purchases have benefited our shareholders as they continue to see sustained yield when it comes to our BTC holdings from a per share perspective. A shareholder holding one million shares of MARA stock hypothetically holds approximately 100 BTC as of the end of Q1 2025, reflecting a 3.5% increase in BTC yield per share since December 31, 2024. BTC yield is a key performance indicator that represents the ratio between our BTC holdings and fully diluted shares outstanding. Finally, it is important to note that our bitcoin holdings per share is almost three times more than our closest competition.
During Q1 2025, we raised $100.1 million from at-the-market (“ATM”) equity sales which we primarily used for miner purchases, operating costs, acquisition of infrastructure and for other general corporate purposes. Additionally, during the quarter we commenced a new ATM offering for an aggregate offering price of up to $2.0 billion.
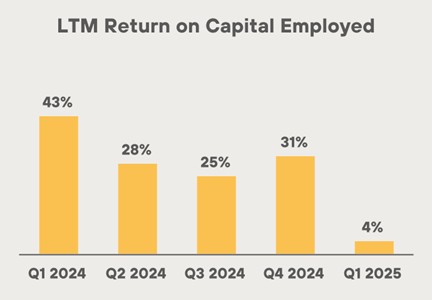
MARA’s ROCE (defined as Trailing 12-months Adjusted EBITDA divided by Average Capital Employed) during the last 12-month period was impacted by the loss on digital assets (including BTC receivable) in Q1 2025 given the decline in bitcoin price at the end of the quarter versus December 31, 2024. Since the end of the quarter, we have seen a substantial increase in the price of bitcoin. If that strength continues or even holds steady, it will have a positive impact on second quarter results. MARA carefully and systematically invests in its mining and data center operations and creates value for its stockholders from a capital efficiency standpoint in this capital intensive industry. While ATMs have been the primary source of capital in this sector, as the industry evolves, we expect additional sources of capital and project finance availability, reducing reliance on ATM sales over time.
*including loaned and collateralized BTC
 |
|
| MARA Chief Financial Officer |
|
SHAREHOLDER LETTER Q1 2025 | 12 |
Earnings Webcast and Conference Call
MARA will hold a webcast and conference call today, May 8, 2025, at 5:00 p.m. Eastern time to discuss its financial results for the quarter ended March 31, 2025.
To register to participate in the conference call or to listen to the live audio webcast, please use this link. The webcast will also be broadcast live and available for replay via the investor relations section of our website.
Earnings Webcast and Conference Call Details
Date: Thursday, May 8, 2025
Time: 5:00 p.m. Eastern time (2:00 p.m. Pacific time)
Registration link: LINK
If you have any difficulty connecting with the conference call, please contact MARA’s investor relations team at ir@mara.com
About MARA
MARA (NASDAQ: MARA) is a vertically integrated digital energy and infrastructure company that leverages high-intensity compute, such as bitcoin mining, to monetize excess energy and optimize power management. We are focused on two key priorities: strategically growing by shifting our model toward low-cost energy with more efficient capital deployment and bringing to market a full suite of solutions for data centers and edge inference - including energy management, load balancing and advanced cooling.
For more information, visit www.mara.com, or follow us on:
|
|
@MARAHoldings |
| MARAHoldings | |
| MARAHoldings | |
| @MARAHoldingsinc |
MARA Company Contacts:
Telephone: 1.800.804.1690
Email: ir@mara.com
MARA Media Contact:
Email: mara@wachsman.com
|
SHAREHOLDER LETTER Q1 2025 | 13 |
MARA Holdings, Inc. and Subsidiaries
Condensed Consolidated Statements of Operations (unaudited)
| Three Months Ended March 31, | ||||||||
| (in thousands, except share and per share data) | 2025 | 2024 | ||||||
| Revenues | $ | 213,884 | $ | 165,198 | ||||
| Costs and operating expenses (income) | ||||||||
| Purchased energy costs | 43,481 | 6,088 | ||||||
| Third party hosting and other energy costs | 68,183 | 69,566 | ||||||
| Operating and maintenance costs | 19,794 | 15,814 | ||||||
| General and administrative | 85,865 | 68,906 | ||||||
| Depreciation and amortization | 157,897 | 81,602 | ||||||
| Change in fair value of digital assets | 394,162 | (488,807 | ) | |||||
| Change in fair value of derivative instrument | (26,828 | ) | 15,252 | |||||
| Taxes other than on income | 3,095 | 2,510 | ||||||
| Early termination expenses | — | 22,097 | ||||||
| Research and development | 9,298 | 2,466 | ||||||
| Total costs and operating expenses (income) | 754,947 | (204,506 | ) | |||||
| Operating income (loss) | (541,063 | ) | 369,704 | |||||
| Other income (loss) | ||||||||
| Change in fair value of digital assets - receivable, net | (116,067 | ) | — | |||||
| Interest income | 11,995 | 2,573 | ||||||
| Interest expense | (9,941 | ) | (1,256 | ) | ||||
| Equity in net earnings of unconsolidated affiliate | (13 | ) | 1,259 | |||||
| Other | 2,474 | 2,944 | ||||||
| Total other income (loss) | (111,552 | ) | 5,520 | |||||
| Income (loss) before income taxes | (652,615 | ) | 375,224 | |||||
| Income tax benefit (expense) | 119,172 | (38,051 | ) | |||||
| Net income (loss) | $ | (533,443 | ) | $ | 337,173 | |||
| Less: net loss attributable to noncontrolling interest | 244 | — | ||||||
| Net income (loss) attributable to common stockholders | $ | (533,199 | ) | $ | 337,173 | |||
| Net income (loss) per share of common stock - basic | $ | (1.55 | ) | $ | 1.30 | |||
| Weighted average shares of common stock - basic | 344,098,009 | 259,098,664 | ||||||
| Net income (loss) per share of common stock - diluted | $ | (1.55 | ) | $ | 1.26 | |||
| Weighted average shares of common stock - diluted | 344,098,009 | 267,912,443 | ||||||
| Three Months Ended March 31, | ||||||||
| (in thousands, except share and per share data) | 2025 | 2024 | ||||||
| Reconciliation to Adjusted EBITDA: | ||||||||
| Net income (loss) attributable to common stockholders | $ | (533,199 | ) | $ | 337,173 | |||
| Interest income, net | (2,054 | ) | (1,317 | ) | ||||
| Income tax expense (benefit) | (119,172 | ) | 38,051 | |||||
| Depreciation and amortization | 161,002 | 84,185 | ||||||
| EBITDA | (493,423 | ) | 458,092 | |||||
| Stock based compensation expense | 49,115 | 51,913 | ||||||
| Change in fair value of derivative instrument | (26,828 | ) | 15,252 | |||||
| Net gain on investments | (12,429 | ) | (5,236 | ) | ||||
| Early termination expenses | — | 22,097 | ||||||
| Adjusted EBITDA (1) | $ | (483,565 | ) | $ | 542,118 | |||
|
SHAREHOLDER LETTER Q1 2025 | 14 |
| Three Months Ended | ||||||||||||||||||||
| (in thousands, except return on capital employed) | March 31, 2025 |
December 31, 2024 |
September 30, 2024 |
June 30, 2024 |
March 31, 2024 |
|||||||||||||||
| Reconciliation of last twelve month (“LTM”) net income to LTM Adjusted EBITDA (2): | ||||||||||||||||||||
| Net income (loss) attributable to common stockholders | $ | (329,119 | ) | $ | 541,253 | $ | 164,551 | $ | 288,950 | $ | 479,647 | |||||||||
| Interest expense (income), net | (4,452 | ) | (3,715 | ) | (4,068 | ) | (406 | ) | 3,255 | |||||||||||
| Income tax expense (benefit) | (81,728 | ) | 75,495 | (26,692 | ) | 22,542 | 54,402 | |||||||||||||
| Depreciation and amortization | 518,371 | 441,554 | 372,749 | 321,814 | 248,042 | |||||||||||||||
| EBITDA | 103,072 | 1,054,587 | 506,540 | 632,900 | 785,346 | |||||||||||||||
| Stock based compensation expense | 154,844 | 157,642 | 122,322 | 104,493 | 80,612 | |||||||||||||||
| Change in fair value of derivative instrument | (40,037 | ) | 2,043 | 35,235 | (22,999 | ) | 15,252 | |||||||||||||
| Net gain on investments | (11,429 | ) | (4,236 | ) | (4,236 | ) | (5,236 | ) | (5,236 | ) | ||||||||||
| Net gain from extinguishment of debt | (13,121 | ) | (13,121 | ) | — | (82,600 | ) | (82,600 | ) | |||||||||||
| Early termination expenses | 15,964 | 38,061 | 38,061 | 27,757 | 22,097 | |||||||||||||||
| Adjusted EBITDA | $ | 209,293 | $ | 1,234,976 | $ | 697,922 | $ | 654,315 | $ | 815,471 | ||||||||||
| LTM total assets | $ | 4,985,767 | $ | 4,113,902 | $ | 2,911,316 | $ | 2,362,224 | $ | 1,926,244 | ||||||||||
| Less: LTM total current liabilities | 155,642 | 81,332 | 65,972 | 60,568 | 42,850 | |||||||||||||||
| Average capital employed | $ | 4,830,125 | $ | 4,032,570 | $ | 2,845,344 | $ | 2,301,656 | $ | 1,883,395 | ||||||||||
| Return on capital employed (1) | 4 | % | 31 | % | 25 | % | 28 | % | 43 | % | ||||||||||
(1) Non-GAAP Financial Measures. In order to provide a more comprehensive understanding of the information used by our management team in financial and operational decision-making, we supplement our Condensed Consolidated Financial Statements that have been prepared in accordance with generally accepted accounting principles in the United States (“GAAP”) with the non-GAAP financial measures of Adjusted EBITDA and return on capital employed .
The Company defines Adjusted EBITDA as (a) GAAP net income (loss) attributable to common stockholders plus (b) adjustments to add back the impacts of (1) interest income, (2) interest expense, (3) income tax expense (benefit), (4) depreciation and amortization and (5) adjustments for non-cash and/or non-recurring items, which currently include (i) stock compensation expense, (ii) change in fair value of derivative instrument, (iii) gain on investments and (iv) early termination expenses. The Company defines return on capital employed as (a) the average trailing four quarters’ Adjusted EBITDA divided by (b) average capital employed calculated by averaging the trailing four quarters of total assets less current liabilities.
Management uses Adjusted EBITDA and return on capital employed, along with the supplemental information provided herein, as a means of understanding, managing and evaluating business performance and to help inform operating decision-making. The Company relies primarily on its Condensed Consolidated Financial Statements to understand, manage and evaluate its financial performance and uses non-GAAP financial measures only supplementally.
We believe that adjusted EBITDA and return on capital employed are useful measures to us and to our investors because they exclude certain financial, capital structure and/or non-cash items that we do not believe directly reflect our core operations and may not be indicative of our recurring operations, in part because they may vary widely across time and within our industry independent of the performance of our core operations. We believe that excluding these items enables us to more effectively evaluate our performance period-over-period and relative to our competitors.
Adjusted EBITDA and return on capital employed are not recognized financial measures under GAAP. When analyzing our operating results, investors should use them in addition to, but not as an alternative for, the most directly comparable financial results calculated and presented in accordance with GAAP. Because our calculation of these non-GAAP financial measures may differ from that of other companies, our presentation of these measures may not be comparable to similarly titled measures of other companies.
(2) Last twelve months (“LTM”) net income and Adjusted EBITDA represent the summation of each of the financial measures for the quarters ended March 31, 2025, December 31, 2024, September 30, 2024, June 30, 2024 and March 31, 2024.
|
SHAREHOLDER LETTER Q1 2025 | 15 |
Investing in our securities involves a high degree of risk. Before making an investment decision, you should carefully consider the risks, uncertainties and forward-looking statements described under the heading “Risk Factors” in our most recent annual report on Form 10-K and any other periodic reports that we may file with the U.S. Securities and Exchange Commission (the “SEC”). If any of these risks were to occur, our business, financial condition or results of operations would likely suffer. In that event, the value of our securities could decline, and you could lose part or all of your investment. The risks and uncertainties we describe are not the only ones facing us. Additional risks not presently known to us or that we currently deem immaterial may also impair our business operations. In addition, our past financial performance may not be a reliable indicator of future performance, and historical trends should not be used to anticipate results in the future. See “Forward-Looking Statements” below.
This press release contains forward-looking statements within the meaning of the federal securities laws. All statements, other than statements of historical fact, included in this press release are forward-looking statements. The words “may,” “will,” “could,” “anticipate,” “expect,” “intend,” “believe,” “continue,” “target” and similar expressions or variations or negatives of these words are intended to identify forward-looking statements, although not all forward-looking statements contain these identifying words. Such forward-looking statements include, among other things, statements related to our strategy, future operations, growth targets, developing technologies and expansion into adjacent markets. Such forward-looking statements are based on management’s current expectations about future events as of the date hereof and involve many risks and uncertainties that could cause our actual results to differ materially from those expressed or implied in our forward-looking statements. Subsequent events and developments, including actual results or changes in our assumptions, may cause our views to change. We do not undertake to update our forward-looking statements except to the extent required by applicable law. Readers are cautioned not to place undue reliance on such forward-looking statements. All forward-looking statements included herein are expressly qualified in their entirety by these cautionary statements. Our actual results and outcomes could differ materially from those included in these forward-looking statements as a result of various factors, including, but not limited to, the factors set forth under the heading “Risk Factors” in our most recent annual report on Form 10-K and any other periodic reports that we may file with the SEC.